
- Start >
- Rivers >
- Discharge >
- Isar >
- Obermühlhausen >
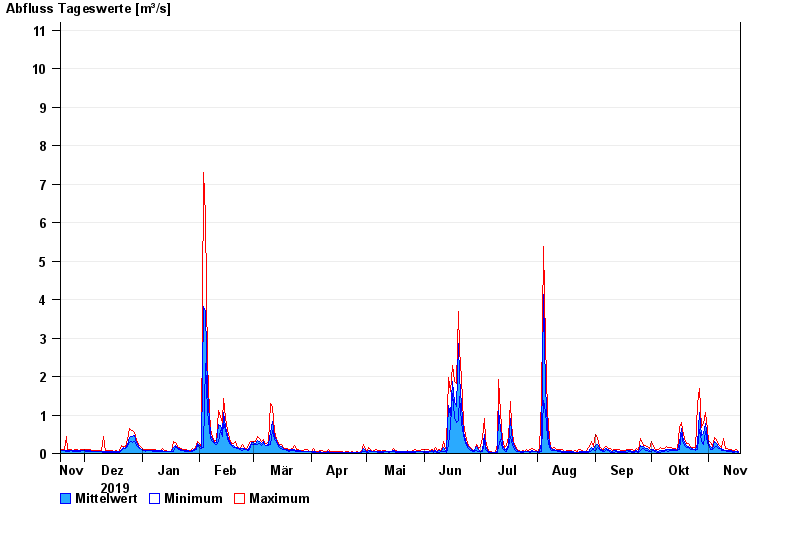
- Chart of year

Chart of year Obermühlhausen / Windach
Discharge from 18.11.2019 to 17.11.2020
- 21.05.1999 Abfluss: 25,6 m³/s
- 06.08.2000 Abfluss: 21,3 m³/s
- 02.06.2013 Abfluss: 18,8 m³/s
- 18.06.1979 Abfluss: 18,7 m³/s
- 13.04.1994 Abfluss: 16,3 m³/s
| Date | Mean value [m³/s] | Maximum [m³/s] | Minimum [m³/s] |
|---|---|---|---|
| 17.11.2020 | 0.044 | 0.054 | 0.028 |
| 16.11.2020 | 0.061 | 0.093 | 0.04 |
| 15.11.2020 | 0.051 | 0.072 | 0.029 |
| 14.11.2020 | 0.052 | 0.072 | 0.029 |
| 13.11.2020 | 0.065 | 0.093 | 0.04 |
| 12.11.2020 | 0.078 | 0.093 | 0.055 |
| 11.11.2020 | 0.082 | 0.117 | 0.055 |
© Bayerisches Landesamt für Umwelt 2024