
- Start >
- Rivers >
- Discharge >
- Isar >
- Obermühlhausen >
- Chart of year

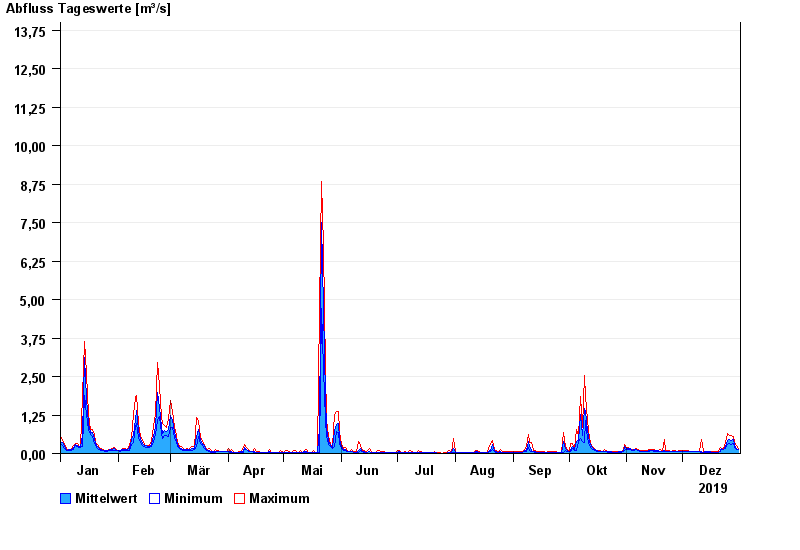
Chart of year Obermühlhausen / Windach
Discharge from 01.01.2019 to 31.12.2019
- 21.05.1999 Abfluss: 25,6 m³/s
- 06.08.2000 Abfluss: 21,3 m³/s
- 02.06.2013 Abfluss: 18,8 m³/s
- 18.06.1979 Abfluss: 18,7 m³/s
- 13.04.1994 Abfluss: 16,3 m³/s
| Date | Mean value [m³/s] | Maximum [m³/s] | Minimum [m³/s] |
|---|---|---|---|
| 31.12.2019 | 0.13 | 0.177 | 0.118 |
| 30.12.2019 | 0.176 | 0.245 | 0.146 |
| 29.12.2019 | 0.273 | 0.364 | 0.21 |
| 28.12.2019 | 0.456 | 0.546 | 0.323 |
| 27.12.2019 | 0.431 | 0.594 | 0.283 |
| 26.12.2019 | 0.451 | 0.594 | 0.323 |
| 25.12.2019 | 0.417 | 0.643 | 0.283 |
© Bayerisches Landesamt für Umwelt 2024