
- Start >
- Rivers >
- Discharge >
- Isar >
- Obermühlhausen >
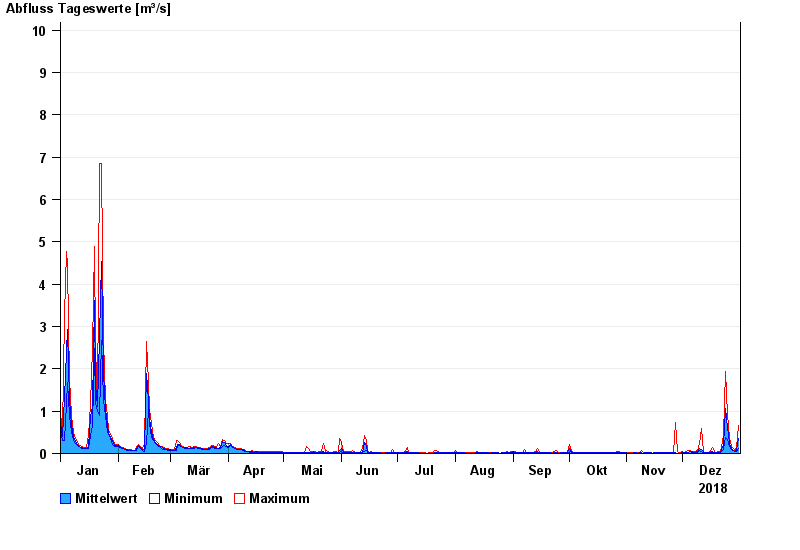
- Chart of year

Chart of year Obermühlhausen / Windach
Discharge from 01.01.2018 to 31.12.2018
- 21.05.1999 Abfluss: 25,6 m³/s
- 06.08.2000 Abfluss: 21,3 m³/s
- 02.06.2013 Abfluss: 18,8 m³/s
- 18.06.1979 Abfluss: 18,7 m³/s
- 13.04.1994 Abfluss: 16,3 m³/s
| Date | Mean value [m³/s] | Maximum [m³/s] | Minimum [m³/s] |
|---|---|---|---|
| 31.12.2018 | 0.356 | 0.672 | 0.11 |
| 30.12.2018 | 0.079 | 0.137 | 0.048 |
| 29.12.2018 | 0.051 | 0.064 | 0.048 |
| 28.12.2018 | 0.076 | 0.107 | 0.064 |
| 27.12.2018 | 0.125 | 0.162 | 0.084 |
| 26.12.2018 | 0.245 | 0.383 | 0.162 |
| 25.12.2018 | 0.617 | 0.923 | 0.342 |
© Bayerisches Landesamt für Umwelt 2024