
- Start >
- Rivers >
- Discharge >
- Isar >
- Obermühlhausen >
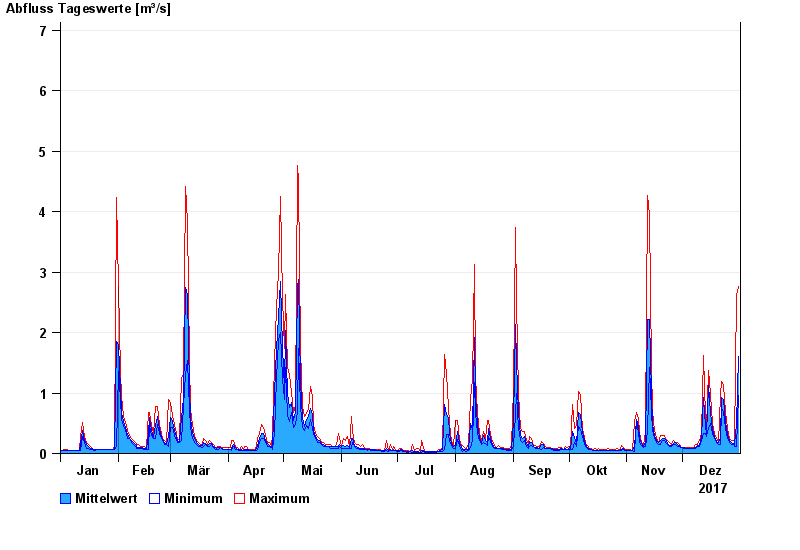
- Chart of year

Chart of year Obermühlhausen / Windach
Discharge from 01.01.2017 to 31.12.2017
- 21.05.1999 Abfluss: 25,6 m³/s
- 06.08.2000 Abfluss: 21,3 m³/s
- 02.06.2013 Abfluss: 18,8 m³/s
- 18.06.1979 Abfluss: 18,7 m³/s
- 13.04.1994 Abfluss: 16,3 m³/s
| Date | Mean value [m³/s] | Maximum [m³/s] | Minimum [m³/s] |
|---|---|---|---|
| 31.12.2017 | 1.61 | 2.76 | 0.952 |
| 30.12.2017 | 0.496 | 2.62 | 0.117 |
| 29.12.2017 | 0.142 | 0.176 | 0.118 |
| 28.12.2017 | 0.17 | 0.209 | 0.145 |
| 27.12.2017 | 0.176 | 0.209 | 0.145 |
| 26.12.2017 | 0.214 | 0.245 | 0.176 |
| 25.12.2017 | 0.321 | 0.408 | 0.245 |
© Bayerisches Landesamt für Umwelt 2024