
- Start >
- Rivers >
- Discharge >
- Isar >
- Oberammergau >
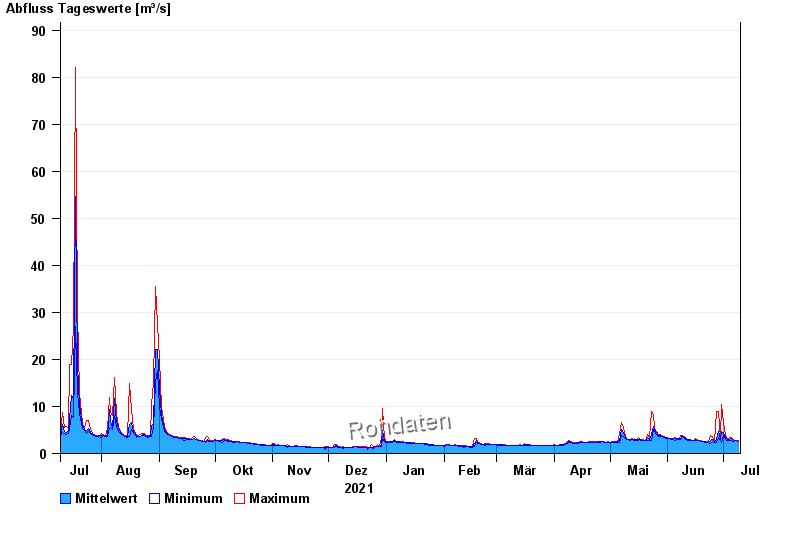
- Chart of year

Chart of year Oberammergau / Ammer
Discharge from 10.07.2021 to 09.07.2022
| Date | Mean value [m³/s] | Maximum [m³/s] | Minimum [m³/s] |
|---|---|---|---|
| 09.07.2022 | 2.61 | 2.68 | 2.51 |
| 08.07.2022 | 2.69 | 2.86 | 2.68 |
| 07.07.2022 | 2.7 | 2.86 | 2.68 |
| 06.07.2022 | 2.79 | 3.05 | 2.51 |
| 05.07.2022 | 3.14 | 3.45 | 2.86 |
| 04.07.2022 | 2.88 | 3.45 | 2.68 |
| 03.07.2022 | 2.94 | 3.05 | 2.86 |
© Bayerisches Landesamt für Umwelt 2024