
- Start >
- Rivers >
- Discharge >
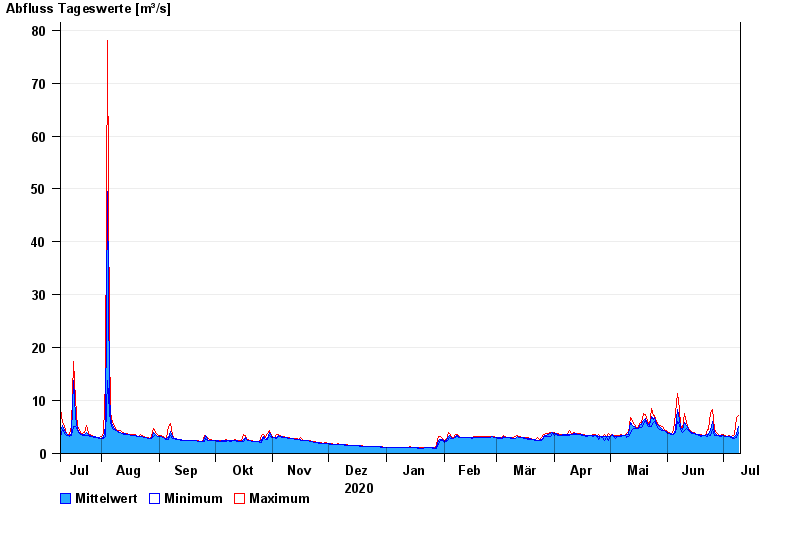
- Isar >
- Oberammergau >
- Chart of year

Chart of year Oberammergau / Ammer
Discharge from 10.07.2020 to 09.07.2021
| Date | Mean value [m³/s] | Maximum [m³/s] | Minimum [m³/s] |
|---|---|---|---|
| 09.07.2021 | 5.15 | 7.16 | 4.01 |
| 08.07.2021 | 3.54 | 6.88 | 2.98 |
| 07.07.2021 | 3.23 | 3.58 | 2.79 |
| 06.07.2021 | 3 | 3.37 | 2.79 |
| 05.07.2021 | 3.16 | 3.17 | 2.98 |
| 04.07.2021 | 3.18 | 3.37 | 3.17 |
| 03.07.2021 | 3.17 | 3.17 | 3.17 |
© Bayerisches Landesamt für Umwelt 2024