
- Start >
- Rivers >
- Discharge >
- Isar >
- Leutstetten >
- Chart of year

Chart of year Leutstetten / Würm
Discharge from 21.10.2020 to 20.10.2021
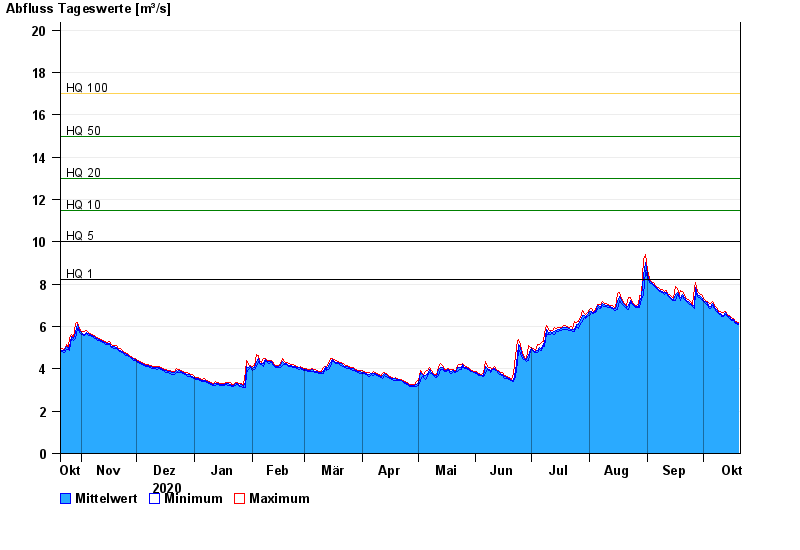
- HQ1 8,2 m³/s
- HQ5 10 m³/s
- HQ10 11,5 m³/s
- HQ20 13 m³/s
- HQ50 15 m³/s
- HQ100 17 m³/s
| Date | Mean value [m³/s] | Maximum [m³/s] | Minimum [m³/s] |
|---|---|---|---|
| 20.10.2021 | 6.15 | 6.21 | 6.09 |
| 19.10.2021 | 6.19 | 6.25 | 6.13 |
| 18.10.2021 | 6.24 | 6.29 | 6.18 |
| 17.10.2021 | 6.32 | 6.37 | 6.27 |
| 16.10.2021 | 6.35 | 6.42 | 6.3 |
| 15.10.2021 | 6.45 | 6.51 | 6.39 |
| 14.10.2021 | 6.54 | 6.59 | 6.46 |
© Bayerisches Landesamt für Umwelt 2024