
- Start >
- Rivers >
- Discharge >
- Isar >
- Leutstetten >
- Chart of year

Chart of year Leutstetten / Würm
Discharge from 21.10.2019 to 20.10.2020
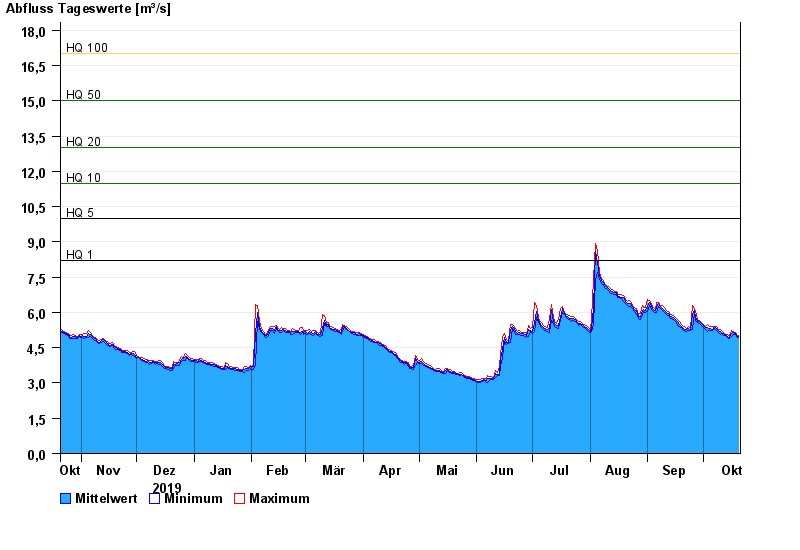
- HQ1 8,2 m³/s
- HQ5 10 m³/s
- HQ10 11,5 m³/s
- HQ20 13 m³/s
- HQ50 15 m³/s
- HQ100 17 m³/s
| Date | Mean value [m³/s] | Maximum [m³/s] | Minimum [m³/s] |
|---|---|---|---|
| 20.10.2020 | 4.97 | 5.03 | 4.92 |
| 19.10.2020 | 5.03 | 5.08 | 4.98 |
| 18.10.2020 | 5.1 | 5.14 | 5.06 |
| 17.10.2020 | 5.13 | 5.19 | 5.07 |
| 16.10.2020 | 5.1 | 5.22 | 4.98 |
| 15.10.2020 | 4.93 | 5.01 | 4.87 |
| 14.10.2020 | 4.99 | 5.04 | 4.93 |
© Bayerisches Landesamt für Umwelt 2024