
- Start >
- Rivers >
- Discharge >
- Isar >
- Leutstetten >
- Chart of year

Chart of year Leutstetten / Würm
Discharge from 21.10.2018 to 20.10.2019
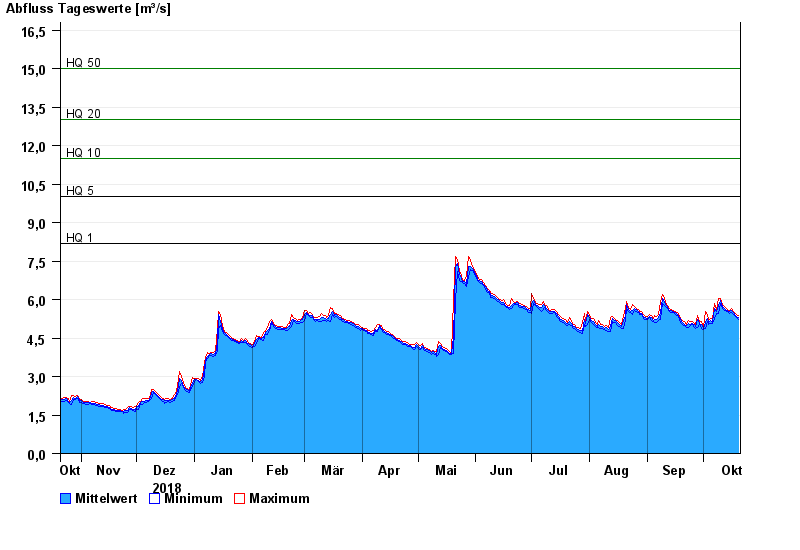
- HQ1 8,2 m³/s
- HQ5 10 m³/s
- HQ10 11,5 m³/s
- HQ20 13 m³/s
- HQ50 15 m³/s
- HQ100 17 m³/s
| Date | Mean value [m³/s] | Maximum [m³/s] | Minimum [m³/s] |
|---|---|---|---|
| 20.10.2019 | 5.29 | 5.36 | 5.24 |
| 19.10.2019 | 5.35 | 5.4 | 5.29 |
| 18.10.2019 | 5.43 | 5.48 | 5.38 |
| 17.10.2019 | 5.48 | 5.54 | 5.43 |
| 16.10.2019 | 5.59 | 5.66 | 5.51 |
| 15.10.2019 | 5.52 | 5.59 | 5.46 |
| 14.10.2019 | 5.57 | 5.62 | 5.52 |
© Bayerisches Landesamt für Umwelt 2024