

Chart of year Hochberg / Traun
Discharge from 28.04.2024 to 27.04.2025
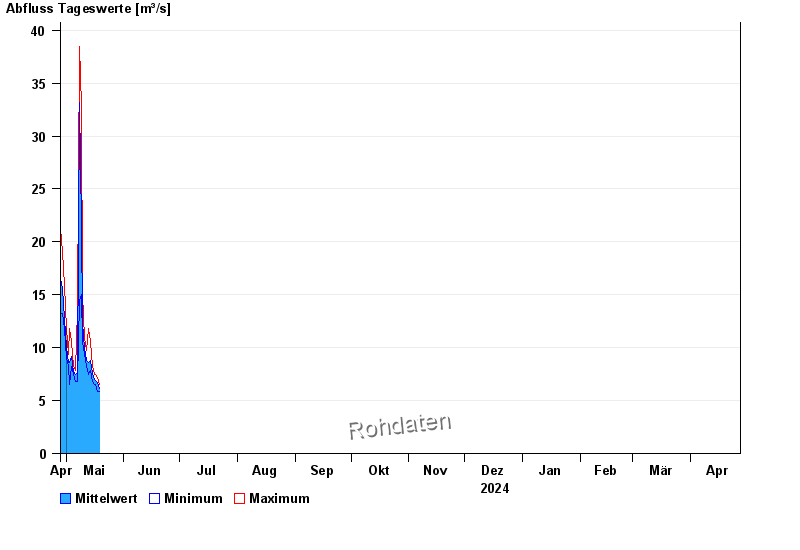
| Date | Mean value [m³/s] | Maximum [m³/s] | Minimum [m³/s] |
|---|---|---|---|
| 08.05.2024 | 31.6 | 38.5 | 14.5 |
| 07.05.2024 | 7.54 | 13.6 | 6.82 |
| 06.05.2024 | 7.44 | 7.88 | 6.82 |
| 05.05.2024 | 7.79 | 8.22 | 7.51 |
| 04.05.2024 | 9.21 | 10.6 | 8.22 |
| 03.05.2024 | 8.63 | 11.8 | 6.51 |
| 02.05.2024 | 8.63 | 9.34 | 8.22 |
© Bayerisches Landesamt für Umwelt 2024