

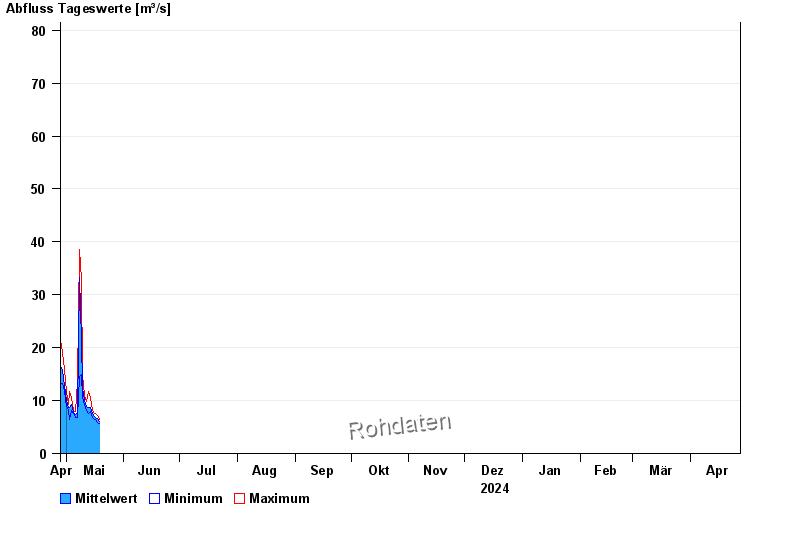
Chart of year Hochberg / Traun
Discharge from 28.04.2024 to 27.04.2025
- HQ1 135 m³/s
- HQ2 170 m³/s
- HQ5 229 m³/s
- HQ10 267 m³/s
- HQ20 311 m³/s
- HQ50 360 m³/s
- HQ100 420 m³/s
| Date | Mean value [m³/s] | Maximum [m³/s] | Minimum [m³/s] |
|---|---|---|---|
| 30.05.2024 | 7.26 | 7.51 | 7.18 |
| 29.05.2024 | 8.15 | 9.34 | 7.18 |
| 28.05.2024 | 9.07 | 11.4 | 7.18 |
| 27.05.2024 | 7.59 | 8.6 | 6.82 |
| 26.05.2024 | 10.2 | 14.1 | 7.88 |
| 25.05.2024 | 9.64 | 19.1 | 7.51 |
| 24.05.2024 | 12.3 | 20.2 | 8.6 |
© Bayerisches Landesamt für Umwelt 2024