

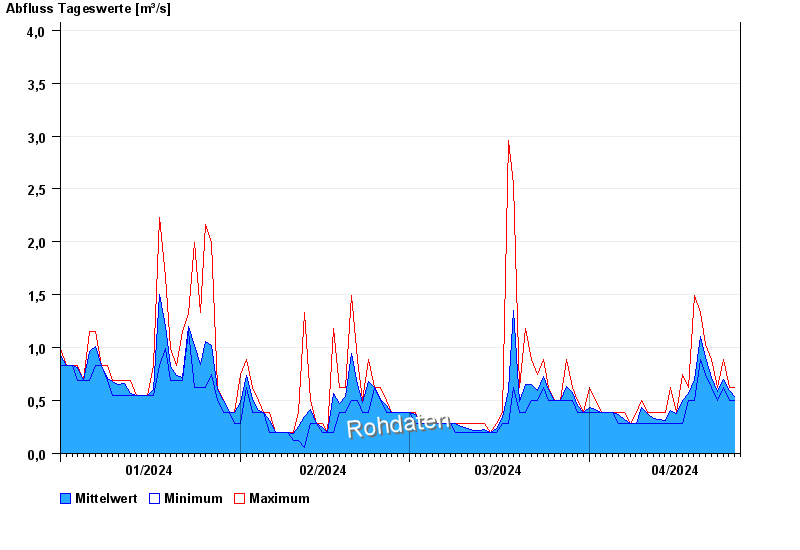
Chart of year Hammer / Oberteisendorfer Ache
Discharge from 01.01.2024 to 26.04.2024
- 04.08.2020 Abfluss: 46,5 m³/s
- 11.06.1971 Abfluss: 32,5 m³/s
- 12.08.2002 Abfluss: 32,2 m³/s
- 10.06.1965 Abfluss: 31,4 m³/s
- 26.06.1995 Abfluss: 25 m³/s
| Date | Mean value [m³/s] | Maximum [m³/s] | Minimum [m³/s] |
|---|---|---|---|
| 26.04.2024 | 0.533 | 0.622 | 0.503 |
| 25.04.2024 | 0.595 | 0.622 | 0.503 |
| 24.04.2024 | 0.697 | 0.887 | 0.622 |
| 23.04.2024 | 0.589 | 0.622 | 0.503 |
| 22.04.2024 | 0.72 | 0.887 | 0.622 |
| 21.04.2024 | 0.904 | 1.03 | 0.75 |
| 20.04.2024 | 1.11 | 1.33 | 0.887 |
© Bayerisches Landesamt für Umwelt 2024