

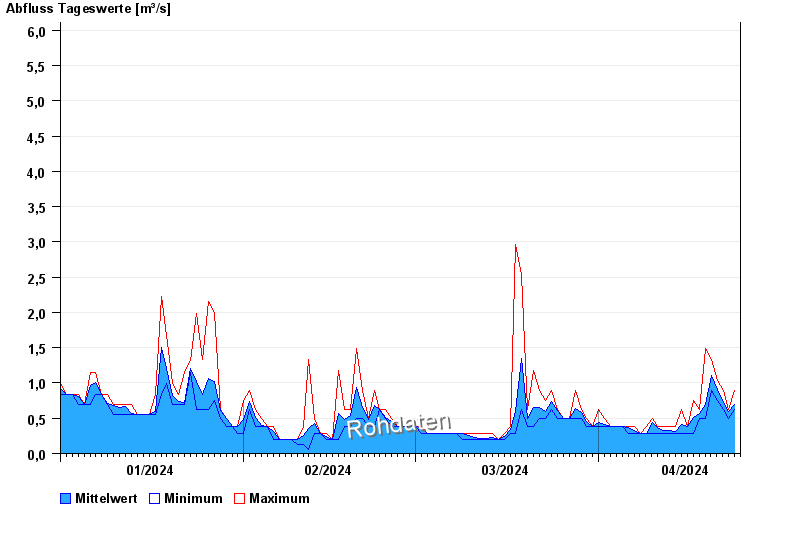
Chart of year Hammer / Oberteisendorfer Ache
Discharge from 01.01.2024 to 24.04.2024
- HQ1 10,9 m³/s
- HQ2 14,3 m³/s
- HQ5 20 m³/s
- HQ10 25 m³/s
- HQ20 30 m³/s
- HQ50 39 m³/s
- HQ100 43 m³/s
| Date | Mean value [m³/s] | Maximum [m³/s] | Minimum [m³/s] |
|---|---|---|---|
| 24.04.2024 | 0.69 | 0.887 | 0.622 |
| 23.04.2024 | 0.589 | 0.622 | 0.503 |
| 22.04.2024 | 0.72 | 0.887 | 0.622 |
| 21.04.2024 | 0.904 | 1.03 | 0.75 |
| 20.04.2024 | 1.11 | 1.33 | 0.887 |
| 19.04.2024 | 0.699 | 1.49 | 0.503 |
| 18.04.2024 | 0.566 | 0.622 | 0.503 |
© Bayerisches Landesamt für Umwelt 2024