

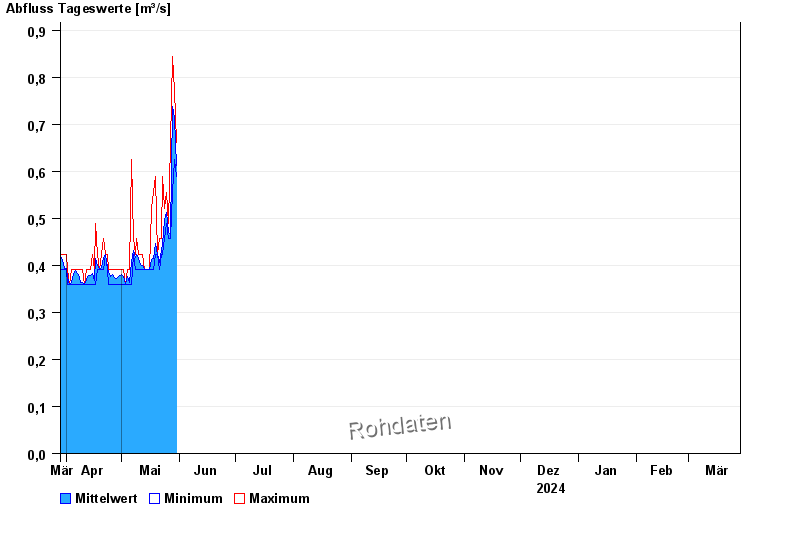
Chart of year Freising / Schleifermoosach
Discharge from 29.03.2024 to 28.03.2025
- 02.06.2013 Abfluss: 16,1 m³/s
- 24.08.2005 Abfluss: 10,9 m³/s
- 23.05.1999 Abfluss: 9,37 m³/s
- 12.08.2002 Abfluss: 8,15 m³/s
- 02.06.1995 Abfluss: 7,97 m³/s
| Date | Mean value [m³/s] | Maximum [m³/s] | Minimum [m³/s] |
|---|---|---|---|
| 11.05.2024 | 0.396 | 0.424 | 0.392 |
| 10.05.2024 | 0.414 | 0.424 | 0.392 |
| 09.05.2024 | 0.423 | 0.457 | 0.392 |
| 08.05.2024 | 0.417 | 0.424 | 0.392 |
| 07.05.2024 | 0.432 | 0.457 | 0.424 |
| 06.05.2024 | 0.409 | 0.626 | 0.36 |
| 05.05.2024 | 0.364 | 0.392 | 0.36 |
© Bayerisches Landesamt für Umwelt 2024