

Chart of year Freising / Schleifermoosach
Discharge from 29.03.2024 to 28.03.2025
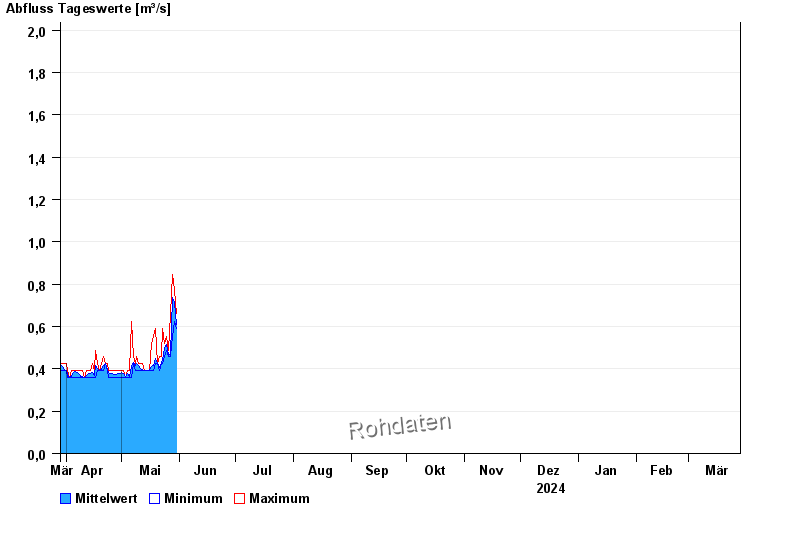 Für diesen Pegel sind keine Jährlichkeiten hinterlegt.
| Date | Mean value [m³/s] | Maximum [m³/s] | Minimum [m³/s] |
|---|---|---|---|
| 11.05.2024 | 0.395 | 0.424 | 0.392 |
| 10.05.2024 | 0.414 | 0.424 | 0.392 |
| 09.05.2024 | 0.423 | 0.457 | 0.392 |
| 08.05.2024 | 0.417 | 0.424 | 0.392 |
| 07.05.2024 | 0.432 | 0.457 | 0.424 |
| 06.05.2024 | 0.409 | 0.626 | 0.36 |
| 05.05.2024 | 0.364 | 0.392 | 0.36 |
© Bayerisches Landesamt für Umwelt 2024