
- Start >
- Rivers >
- Discharge >
- Isar >
- Feldolling >
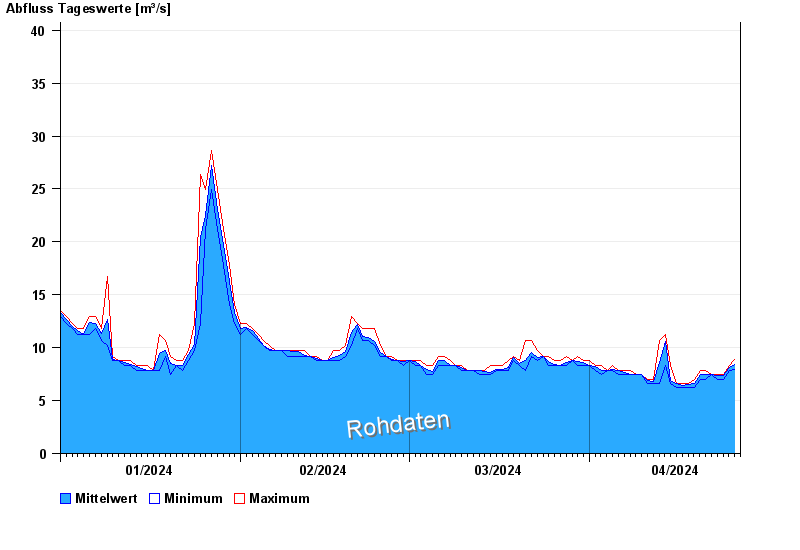
- Chart of year

Chart of year Feldolling / Mangfall
Discharge from 01.01.2024 to 26.04.2024
- 07.07.1946 Abfluss: 294 m³/s
- 31.05.1940 Abfluss: 289 m³/s
- 02.06.2013 Abfluss: 288 m³/s
- 09.07.1954 Abfluss: 272 m³/s
- 22.05.1999 Abfluss: 254 m³/s
| Date | Mean value [m³/s] | Maximum [m³/s] | Minimum [m³/s] |
|---|---|---|---|
| 26.04.2024 | 7.11 | 7.83 | 7.01 |
| 25.04.2024 | 7.35 | 7.42 | 7.01 |
| 24.04.2024 | 7.36 | 7.42 | 7.01 |
| 23.04.2024 | 7.39 | 7.42 | 7.01 |
| 22.04.2024 | 7.42 | 7.42 | 7.42 |
| 21.04.2024 | 7.45 | 7.83 | 7.01 |
| 20.04.2024 | 7.45 | 7.83 | 7.01 |
© Bayerisches Landesamt für Umwelt 2024