
- Start >
- Rivers >
- Discharge >
- Isar >
- Feldolling >
- Chart of year

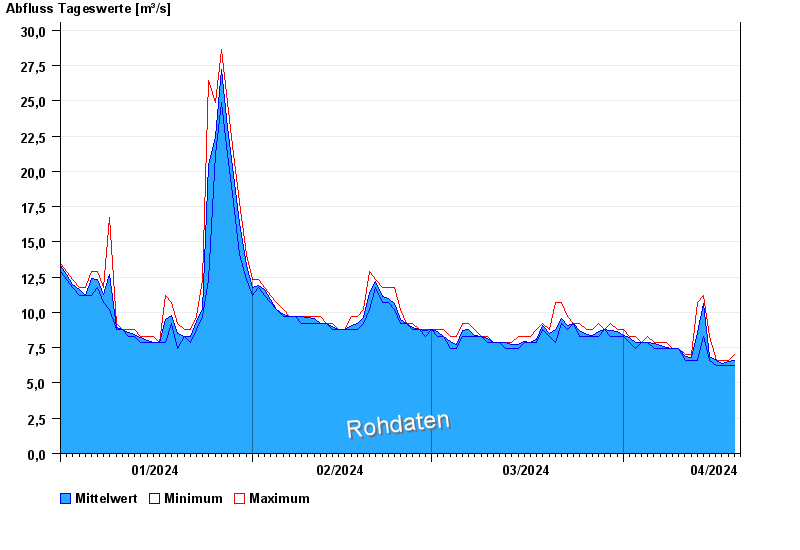
Chart of year Feldolling / Mangfall
Discharge from 01.01.2024 to 19.04.2024
| Date | Mean value [m³/s] | Maximum [m³/s] | Minimum [m³/s] |
|---|---|---|---|
| 19.04.2024 | 6.44 | 6.62 | 6.24 |
| 18.04.2024 | 6.49 | 6.62 | 6.24 |
| 17.04.2024 | 6.41 | 6.62 | 6.24 |
| 16.04.2024 | 6.58 | 6.62 | 6.24 |
| 15.04.2024 | 6.9 | 8.3 | 6.62 |
| 14.04.2024 | 10.6 | 11.2 | 8.3 |
| 13.04.2024 | 8.6 | 10.7 | 6.62 |
© Bayerisches Landesamt für Umwelt 2024