
- Start >
- Rivers >
- Discharge >
- Isar >
- Feldolling >
- Chart of year

Chart of year Feldolling / Mangfall
Discharge from 01.01.2024 to 31.12.2024
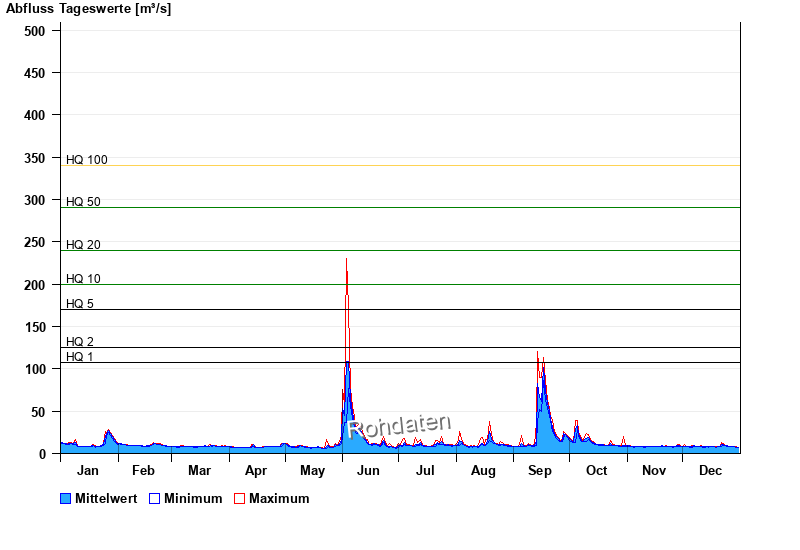
- HQ1 108 m³/s
- HQ2 125 m³/s
- HQ5 170 m³/s
- HQ10 200 m³/s
- HQ20 240 m³/s
- HQ50 290 m³/s
- HQ100 340 m³/s
| Date | Mean value [m³/s] | Maximum [m³/s] | Minimum [m³/s] |
|---|---|---|---|
| 16.05.2024 | 7.1 | 7.1 | 7.1 |
| 15.05.2024 | 7.1 | 7.1 | 7.1 |
| 14.05.2024 | 7.45 | 7.52 | 7.1 |
| 13.05.2024 | 7.57 | 7.94 | 7.52 |
| 12.05.2024 | 7.79 | 7.94 | 7.52 |
| 11.05.2024 | 8.03 | 8.37 | 7.94 |
| 10.05.2024 | 8.86 | 9.3 | 8.37 |
© Bayerisches Landesamt für Umwelt 2024