
- Start >
- Rivers >
- Discharge >
- Isar >
- Feldolling >
- Chart of year

Chart of year Feldolling / Mangfall
Discharge from 01.01.2023 to 31.12.2023
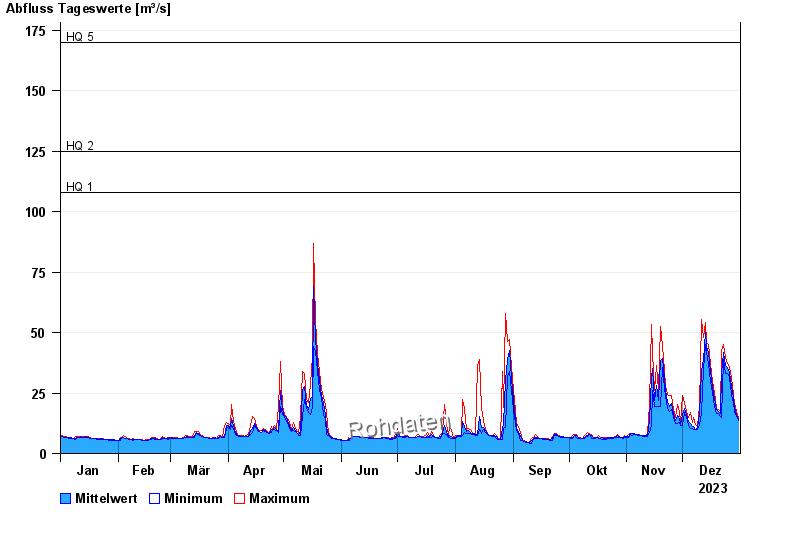
- HQ1 108 m³/s
- HQ2 125 m³/s
- HQ5 170 m³/s
- HQ10 200 m³/s
- HQ20 240 m³/s
- HQ50 290 m³/s
- HQ100 340 m³/s
| Date | Mean value [m³/s] | Maximum [m³/s] | Minimum [m³/s] |
|---|---|---|---|
| 31.12.2023 | 14 | 14.7 | 13.5 |
| 30.12.2023 | 16.3 | 17.3 | 15.3 |
| 29.12.2023 | 18.9 | 20.7 | 17.3 |
| 28.12.2023 | 22.6 | 24.4 | 20.7 |
| 27.12.2023 | 27.9 | 31.4 | 24.4 |
| 26.12.2023 | 33.4 | 35.5 | 31.4 |
| 25.12.2023 | 35.6 | 37.2 | 33.1 |
© Bayerisches Landesamt für Umwelt 2024