

Chart of year Farchant / Loisach
Discharge from 01.01.2020 to 31.12.2020
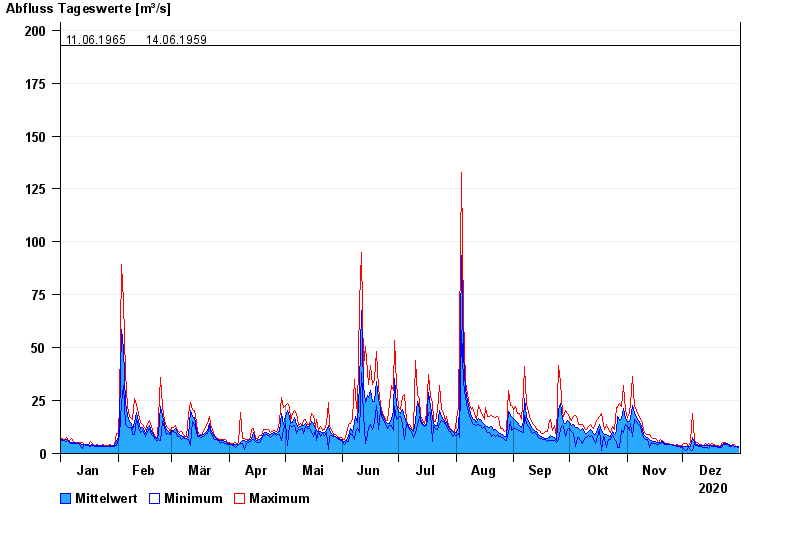
Beeinflussung
Messwerte beeinflusst durch Kraftwerkssteuerung und Kiesumlagerungen. Kiesanlandungen können bei Niedrigwasser Trockenlegung der Messinstrumente bewirken.
- 22.05.1999 Abfluss: 333 m³/s
- 10.08.1970 Abfluss: 212 m³/s
- 18.07.2021 Abfluss: 206 m³/s
- 11.06.1965 Abfluss: 193 m³/s
- 14.06.1959 Abfluss: 193 m³/s
| Date | Mean value [m³/s] | Maximum [m³/s] | Minimum [m³/s] |
|---|---|---|---|
| 31.12.2020 | 3.1 | 3.21 | 3.04 |
| 30.12.2020 | 3.27 | 3.4 | 3.21 |
| 29.12.2020 | 3.5 | 4.04 | 2.72 |
| 28.12.2020 | 3.73 | 4.04 | 3.6 |
| 27.12.2020 | 3.62 | 3.81 | 3.21 |
| 26.12.2020 | 4 | 4.28 | 3.4 |
| 25.12.2020 | 4.53 | 4.8 | 4.28 |
© Bayerisches Landesamt für Umwelt 2025