

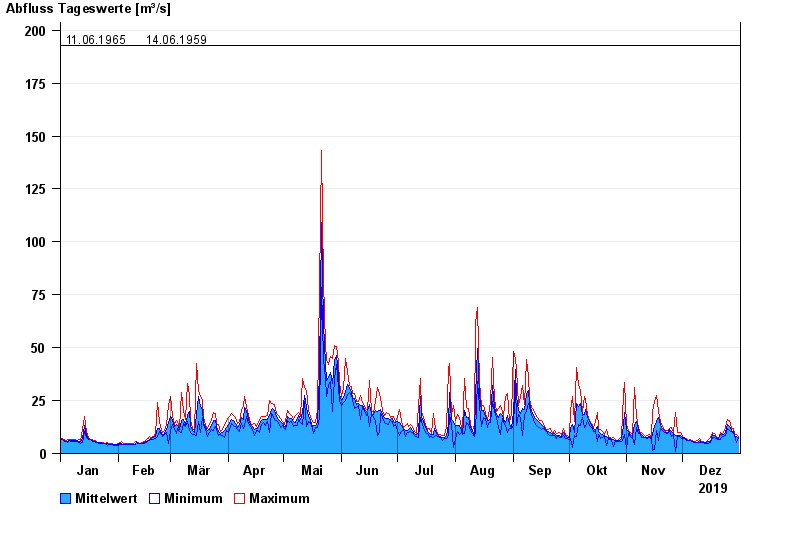
Chart of year Farchant / Loisach
Discharge from 01.01.2019 to 31.12.2019
note
Messwerte beeinflusst durch Kraftwerkssteuerungen und Kiesanladungen. Kiesumlagerungen bewirkt Trockenlegung der Messinstrumente ab 12.12.2022
- 22.05.1999 Abfluss: 333 m³/s
- 10.08.1970 Abfluss: 212 m³/s
- 18.07.2021 Abfluss: 206 m³/s
- 11.06.1965 Abfluss: 193 m³/s
- 14.06.1959 Abfluss: 193 m³/s
| Date | Mean value [m³/s] | Maximum [m³/s] | Minimum [m³/s] |
|---|---|---|---|
| 31.12.2019 | 7.48 | 7.88 | 7.41 |
| 30.12.2019 | 7.85 | 8.78 | 5.43 |
| 29.12.2019 | 8.52 | 9.25 | 8.28 |
| 28.12.2019 | 10.2 | 11.9 | 9.24 |
| 27.12.2019 | 10.8 | 11.9 | 10.2 |
| 26.12.2019 | 12.6 | 15.5 | 10.8 |
| 25.12.2019 | 13.5 | 16.1 | 11.8 |
© Bayerisches Landesamt für Umwelt 2024