
- Start >
- Rivers >
- Discharge >
- Isar >
- Eschelbach Q >
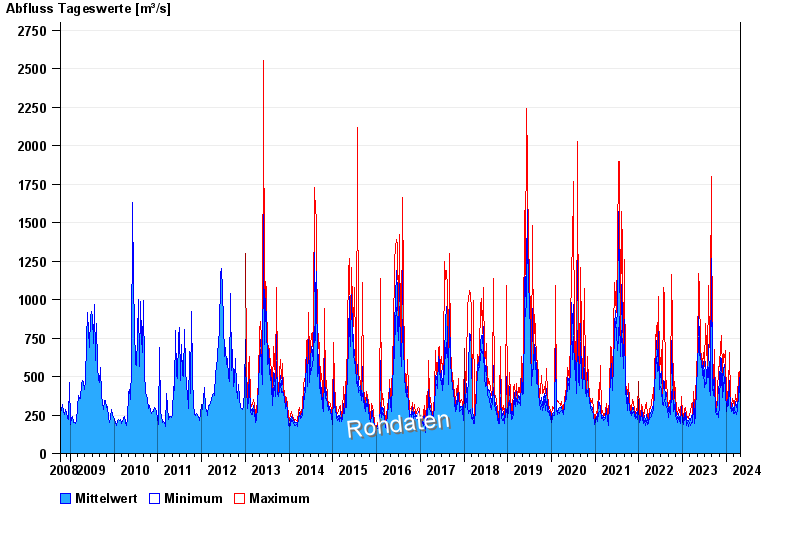
- Chart of total period

Chart of total period Eschelbach Q / Inn
Discharge from 10.10.2008 to 27.04.2024
 Für diesen Pegel sind keine -Winter hinterlegt.
| Date | Mean value [m³/s] | Maximum [m³/s] | Minimum [m³/s] |
|---|---|---|---|
| 27.04.2024 | 273 | 277 | 268 |
| 26.04.2024 | 275 | 300 | 258 |
| 25.04.2024 | 292 | 310 | 278 |
| 24.04.2024 | 312 | 335 | 293 |
| 23.04.2024 | 336 | 364 | 304 |
| 22.04.2024 | 322 | 343 | 301 |
| 21.04.2024 | 331 | 359 | 301 |
© Bayerisches Landesamt für Umwelt 2024