
- Start >
- Rivers >
- Discharge >
- Isar >
- Eschelbach Q >
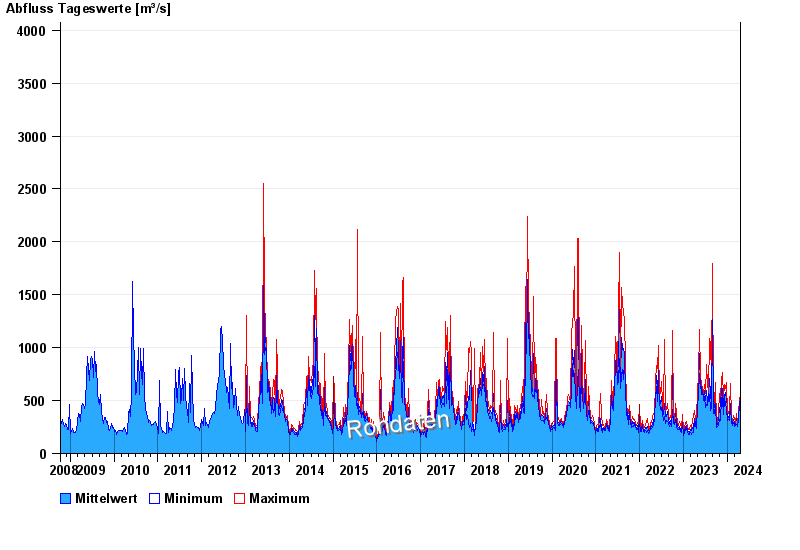
- Chart of total period

Chart of total period Eschelbach Q / Inn
Discharge from 10.10.2008 to 20.04.2024
 Für diesen Pegel sind keine historische Ereignisse hinterlegt.
| Date | Mean value [m³/s] | Maximum [m³/s] | Minimum [m³/s] |
|---|---|---|---|
| 20.04.2024 | 342 | 351 | 335 |
| 19.04.2024 | 384 | 452 | 344 |
| 18.04.2024 | 458 | 476 | 447 |
| 17.04.2024 | 505 | 535 | 463 |
| 16.04.2024 | 511 | 532 | 491 |
| 15.04.2024 | 461 | 528 | 377 |
| 14.04.2024 | 356 | 379 | 335 |
© Bayerisches Landesamt für Umwelt 2024