

Chart of total period Engen / Illach
Discharge from 01.11.1953 to 10.05.2024
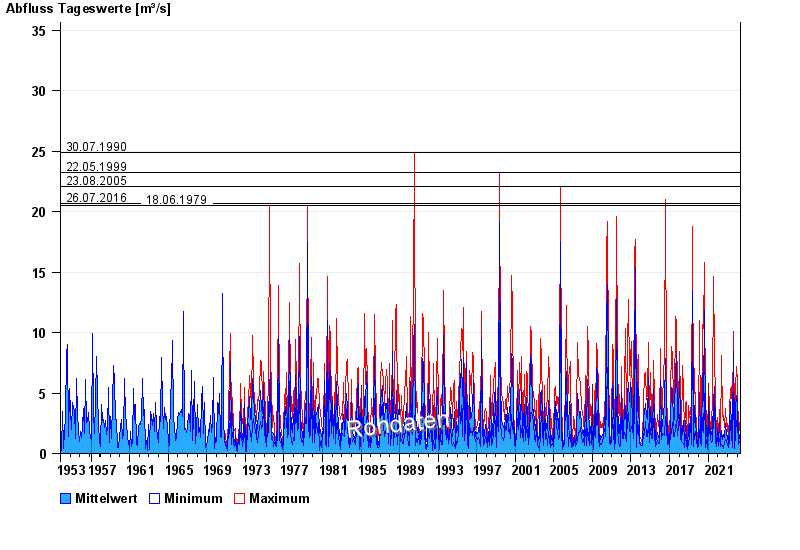
- 30.07.1990 Abfluss: 24,9 m³/s
- 22.05.1999 Abfluss: 23,2 m³/s
- 23.08.2005 Abfluss: 22,1 m³/s
- 26.07.2016 Abfluss: 20,7 m³/s
- 18.06.1979 Abfluss: 20,5 m³/s
| Date | Mean value [m³/s] | Maximum [m³/s] | Minimum [m³/s] |
|---|---|---|---|
| 10.05.2024 | 0.616 | 0.691 | 0.542 |
| 09.05.2024 | 0.882 | 1.16 | 0.64 |
| 08.05.2024 | 1.22 | 2.16 | 0.495 |
| 07.05.2024 | 0.445 | 0.59 | 0.28 |
| 06.05.2024 | 0.479 | 1.1 | 0.361 |
| 05.05.2024 | 0.383 | 0.405 | 0.361 |
| 04.05.2024 | 0.398 | 0.449 | 0.361 |
© Bayerisches Landesamt für Umwelt 2024