

Chart of total period Engen / Illach
Discharge from 01.11.1953 to 19.04.2024
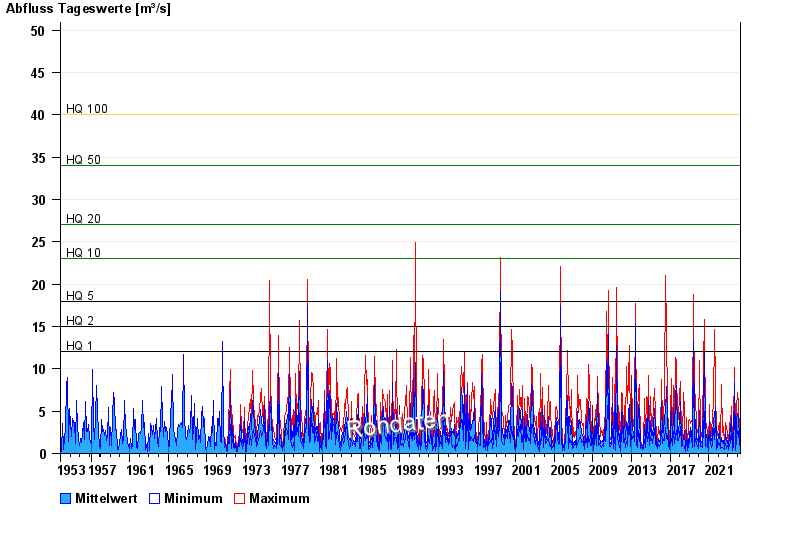
- HQ1 12 m³/s
- HQ2 15 m³/s
- HQ5 18 m³/s
- HQ10 23 m³/s
- HQ20 27 m³/s
- HQ50 34 m³/s
- HQ100 40 m³/s
| Date | Mean value [m³/s] | Maximum [m³/s] | Minimum [m³/s] |
|---|---|---|---|
| 19.04.2024 | 0.872 | 0.916 | 0.797 |
| 18.04.2024 | 0.618 | 0.977 | 0.495 |
| 17.04.2024 | 0.412 | 0.691 | 0.32 |
| 16.04.2024 | 0.326 | 0.405 | 0.32 |
| 15.04.2024 | 0.308 | 0.32 | 0.28 |
| 14.04.2024 | 0.317 | 0.361 | 0.28 |
| 13.04.2024 | 0.334 | 0.405 | 0.28 |
© Bayerisches Landesamt für Umwelt 2024