
- Start >
- Rivers >
- Discharge >
- Isar >
- Burghausen >
- Chart of year

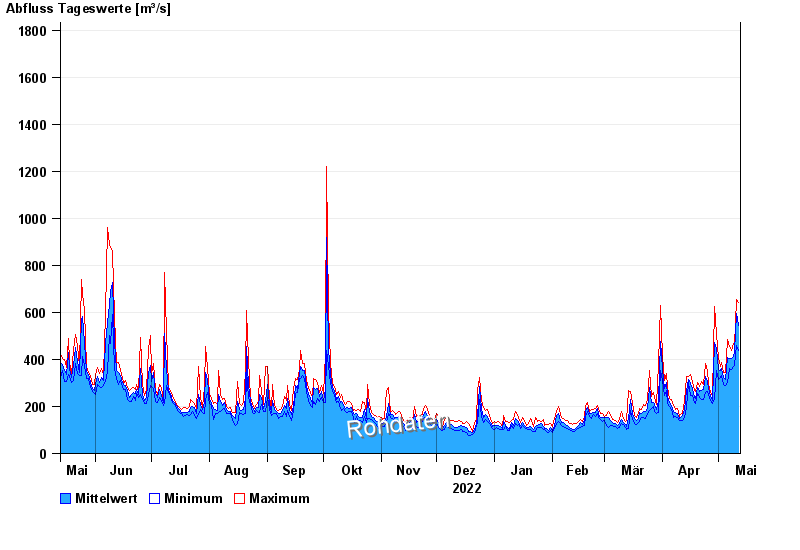
Chart of year Burghausen / Salzach
Discharge from 13.05.2022 to 12.05.2023
- 03.06.2013 Abfluss: 4000 m³/s
- 14.09.1899 Abfluss: 3350 m³/s
- 08.09.1920 Abfluss: 3150 m³/s
- 13.08.2002 Abfluss: 3100 m³/s
- 14.08.1959 Abfluss: 3010 m³/s
| Date | Mean value [m³/s] | Maximum [m³/s] | Minimum [m³/s] |
|---|---|---|---|
| 12.05.2023 | 546 | 642 | 439 |
| 11.05.2023 | 596 | 653 | 461 |
| 10.05.2023 | 434 | 461 | 376 |
| 09.05.2023 | 411 | 467 | 371 |
| 08.05.2023 | 406 | 439 | 358 |
| 07.05.2023 | 405 | 456 | 361 |
| 06.05.2023 | 410 | 485 | 304 |
© Bayerisches Landesamt für Umwelt 2024