
- Start >
- Rivers >
- Discharge >
- Isar >
- Burghausen >
- Chart of year

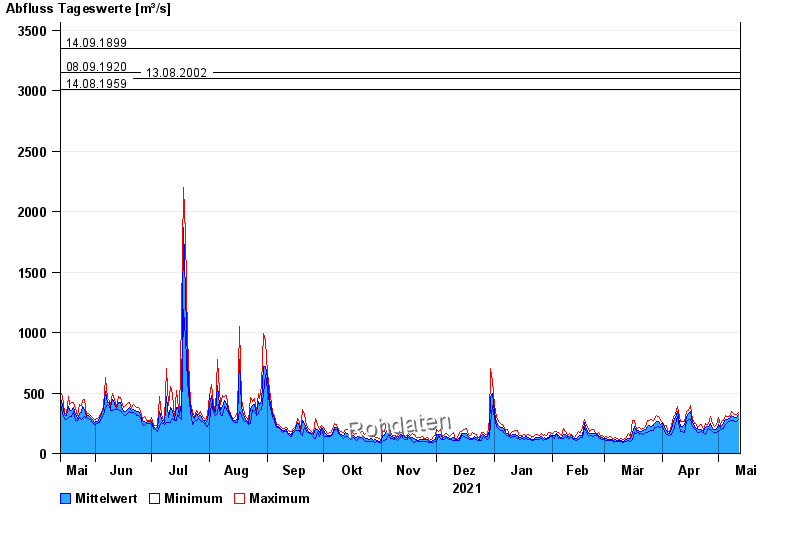
Chart of year Burghausen / Salzach
Discharge from 13.05.2021 to 12.05.2022
- 03.06.2013 Abfluss: 4000 m³/s
- 14.09.1899 Abfluss: 3350 m³/s
- 08.09.1920 Abfluss: 3150 m³/s
- 13.08.2002 Abfluss: 3100 m³/s
- 14.08.1959 Abfluss: 3010 m³/s
| Date | Mean value [m³/s] | Maximum [m³/s] | Minimum [m³/s] |
|---|---|---|---|
| 12.05.2022 | 324 | 342 | 285 |
| 11.05.2022 | 295 | 323 | 261 |
| 10.05.2022 | 301 | 326 | 265 |
| 09.05.2022 | 309 | 333 | 274 |
| 08.05.2022 | 312 | 345 | 274 |
| 07.05.2022 | 288 | 304 | 267 |
| 06.05.2022 | 282 | 302 | 256 |
© Bayerisches Landesamt für Umwelt 2024