

Chart of total period Berg / Sempt
Discharge from 01.11.1961 to 26.04.2024
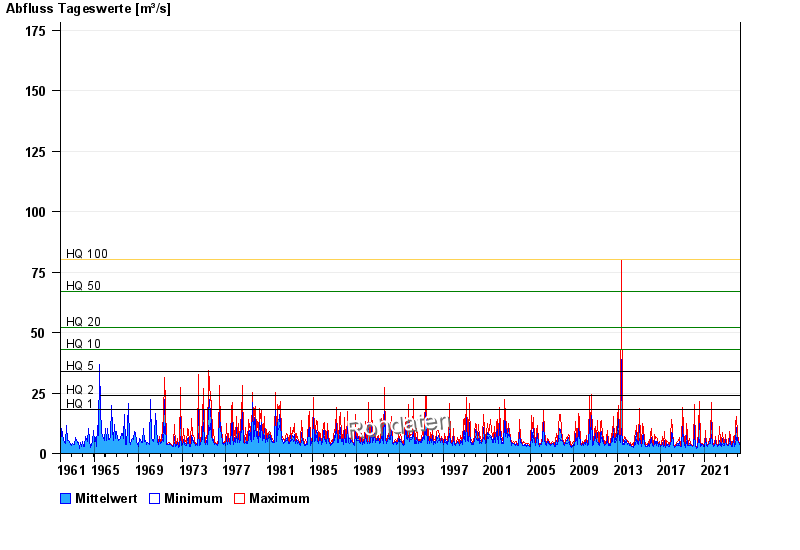
- HQ1 18 m³/s
- HQ2 24 m³/s
- HQ5 34 m³/s
- HQ10 43 m³/s
- HQ20 52 m³/s
- HQ50 67 m³/s
- HQ100 80 m³/s
| Date | Mean value [m³/s] | Maximum [m³/s] | Minimum [m³/s] |
|---|---|---|---|
| 26.04.2024 | 3.89 | 3.93 | 3.84 |
| 25.04.2024 | 3.93 | 3.93 | 3.84 |
| 24.04.2024 | 3.98 | 4.04 | 3.93 |
| 23.04.2024 | 3.99 | 4.04 | 3.93 |
| 22.04.2024 | 4.12 | 4.26 | 4.04 |
| 21.04.2024 | 4.07 | 4.15 | 3.93 |
| 20.04.2024 | 3.93 | 4.04 | 3.84 |
© Bayerisches Landesamt für Umwelt 2024