

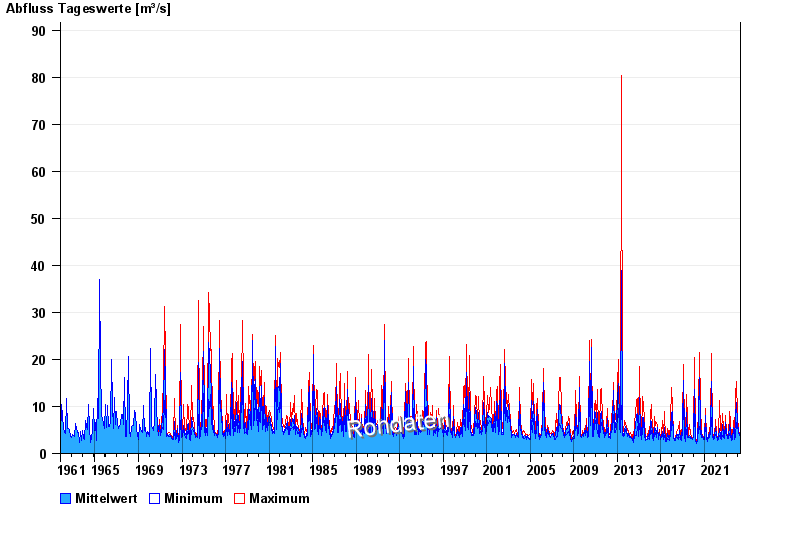
Chart of total period Berg / Sempt
Discharge from 01.11.1961 to 24.04.2024
| Date | Mean value [m³/s] | Maximum [m³/s] | Minimum [m³/s] |
|---|---|---|---|
| 24.04.2024 | 3.97 | 4.04 | 3.93 |
| 23.04.2024 | 3.99 | 4.04 | 3.93 |
| 22.04.2024 | 4.12 | 4.26 | 4.04 |
| 21.04.2024 | 4.07 | 4.15 | 3.93 |
| 20.04.2024 | 3.93 | 4.04 | 3.84 |
| 19.04.2024 | 3.9 | 3.93 | 3.84 |
| 18.04.2024 | 3.91 | 3.93 | 3.84 |
© Bayerisches Landesamt für Umwelt 2024