
- Start >
- Rivers >
- Discharge >
- Isar >
- Bad Wiessee >
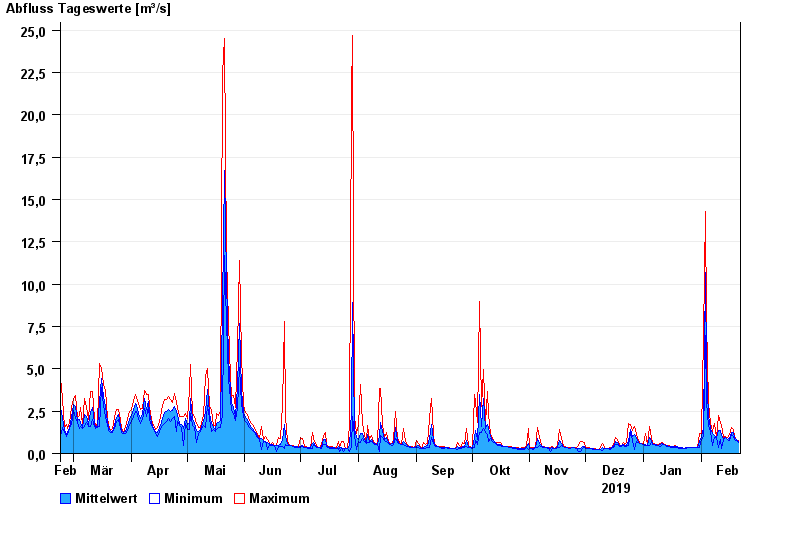
- Chart of year

Chart of year Bad Wiessee / Söllbach
Discharge from 22.02.2019 to 21.02.2020
| Date | Mean value [m³/s] | Maximum [m³/s] | Minimum [m³/s] |
|---|---|---|---|
| 21.02.2020 | 0.722 | 0.756 | 0.679 |
| 20.02.2020 | 0.813 | 0.838 | 0.756 |
| 19.02.2020 | 0.961 | 1.02 | 0.838 |
| 18.02.2020 | 1.23 | 1.44 | 1.02 |
| 17.02.2020 | 1.23 | 1.56 | 1.11 |
| 16.02.2020 | 0.875 | 1.11 | 0.753 |
| 15.02.2020 | 0.85 | 0.922 | 0.835 |
© Bayerisches Landesamt für Umwelt 2024