
- Start >
- Rivers >
- Discharge >
- Isar >
- Bad Wiessee >
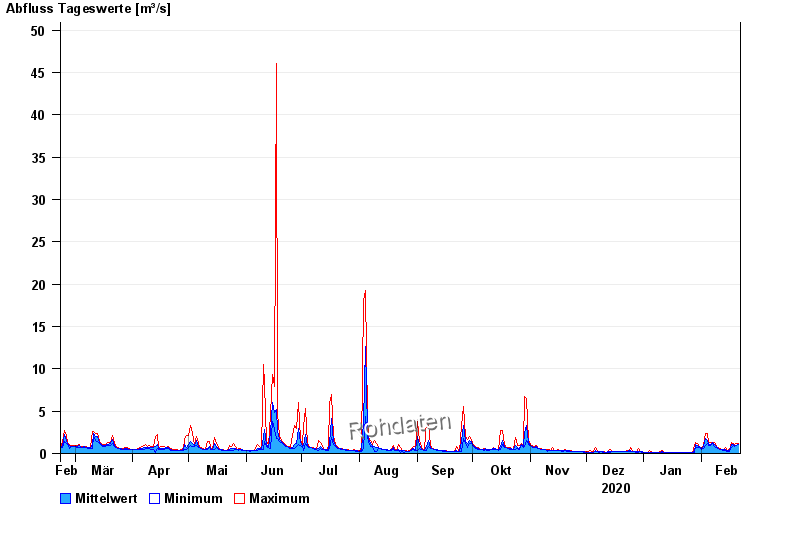
- Chart of year

Chart of year Bad Wiessee / Söllbach
Discharge from 22.02.2020 to 21.02.2021
| Date | Mean value [m³/s] | Maximum [m³/s] | Minimum [m³/s] |
|---|---|---|---|
| 21.02.2021 | 1.1 | 1.24 | 1.04 |
| 20.02.2021 | 1 | 1.14 | 0.948 |
| 19.02.2021 | 0.929 | 1.04 | 0.856 |
| 18.02.2021 | 1.01 | 1.14 | 0.948 |
| 17.02.2021 | 1.06 | 1.32 | 0.674 |
| 16.02.2021 | 0.354 | 0.432 | 0.243 |
| 15.02.2021 | 0.309 | 0.376 | 0.243 |
© Bayerisches Landesamt für Umwelt 2024