
- Start >
- Rivers >
- Discharge >
- Isar >
- Bad Wiessee >
- Chart of year

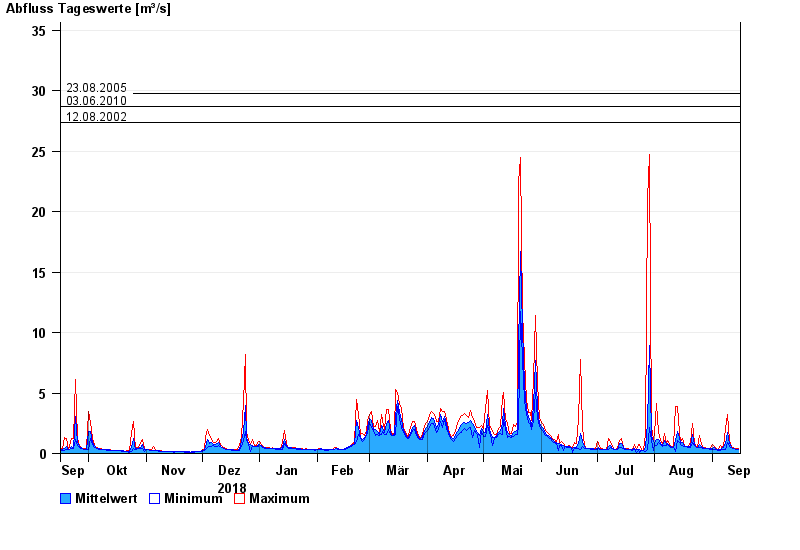
Chart of year Bad Wiessee / Söllbach
Discharge from 16.09.2018 to 15.09.2019
- 21.05.1999 Abfluss: 44,1 m³/s
- 02.06.2013 Abfluss: 40,5 m³/s
- 23.08.2005 Abfluss: 29,8 m³/s
- 03.06.2010 Abfluss: 28,7 m³/s
- 12.08.2002 Abfluss: 27,4 m³/s
| Date | Mean value [m³/s] | Maximum [m³/s] | Minimum [m³/s] |
|---|---|---|---|
| 15.09.2019 | 0.345 | 0.391 | 0.301 |
| 14.09.2019 | 0.364 | 0.389 | 0.342 |
| 13.09.2019 | 0.386 | 0.435 | 0.385 |
| 12.09.2019 | 0.444 | 0.487 | 0.384 |
| 11.09.2019 | 0.519 | 0.61 | 0.485 |
| 10.09.2019 | 0.803 | 1.11 | 0.609 |
| 09.09.2019 | 1.7 | 3.23 | 0.92 |
© Bayerisches Landesamt für Umwelt 2024