
- Start >
- Rivers >
- Discharge >
- Isar >
- Bad Wiessee >
- Chart of year

Chart of year Bad Wiessee / Söllbach
Discharge from 16.09.2019 to 15.09.2020
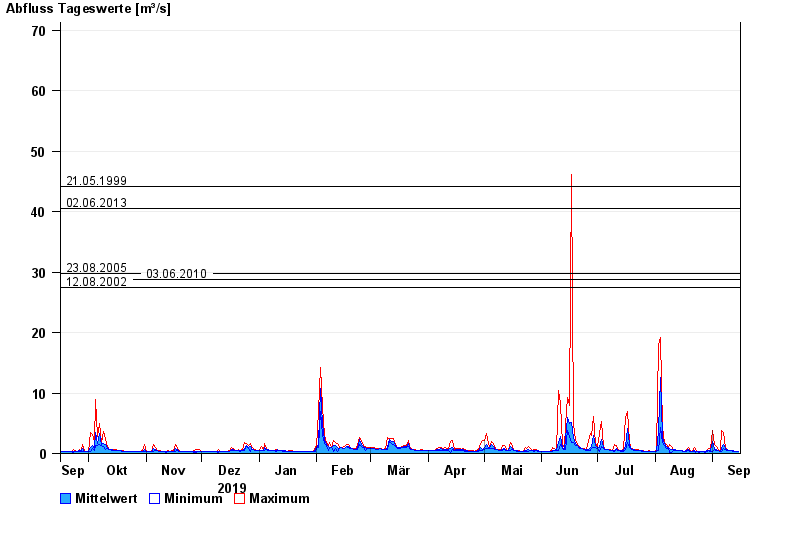
- 21.05.1999 Abfluss: 44,1 m³/s
- 02.06.2013 Abfluss: 40,5 m³/s
- 23.08.2005 Abfluss: 29,8 m³/s
- 03.06.2010 Abfluss: 28,7 m³/s
- 12.08.2002 Abfluss: 27,4 m³/s
| Date | Mean value [m³/s] | Maximum [m³/s] | Minimum [m³/s] |
|---|---|---|---|
| 15.09.2020 | 0.31 | 0.353 | 0.27 |
| 14.09.2020 | 0.345 | 0.4 | 0.309 |
| 13.09.2020 | 0.399 | 0.4 | 0.352 |
| 12.09.2020 | 0.426 | 0.451 | 0.399 |
| 11.09.2020 | 0.464 | 0.509 | 0.45 |
| 10.09.2020 | 0.517 | 0.571 | 0.508 |
| 09.09.2020 | 0.602 | 0.64 | 0.571 |
© Bayerisches Landesamt für Umwelt 2024