

Chart of year Bad Trißl / Auerbach
Discharge from 14.07.2021 to 13.07.2022
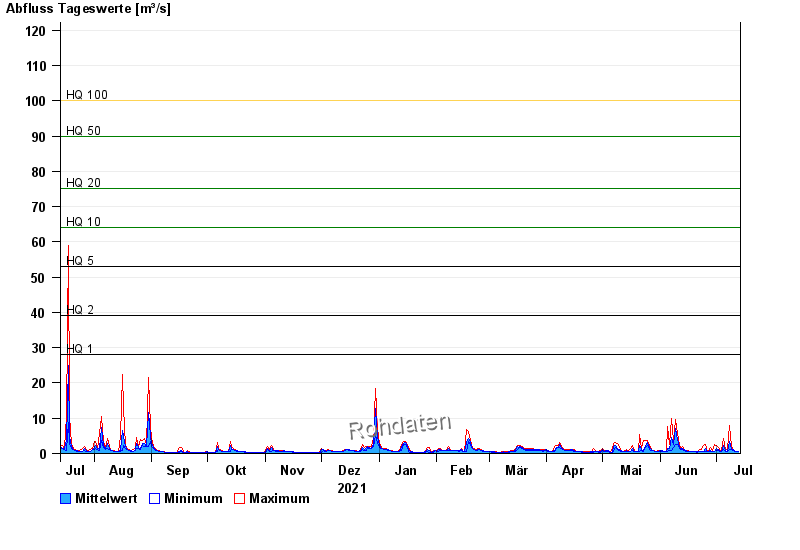
- HQ1 28 m³/s
- HQ2 39 m³/s
- HQ5 53 m³/s
- HQ10 64 m³/s
- HQ20 75 m³/s
- HQ50 90 m³/s
- HQ100 100 m³/s
| Date | Mean value [m³/s] | Maximum [m³/s] | Minimum [m³/s] |
|---|---|---|---|
| 13.07.2022 | 0.554 | 0.572 | 0.502 |
| 12.07.2022 | 0.645 | 0.65 | 0.572 |
| 11.07.2022 | 0.775 | 0.926 | 0.65 |
| 10.07.2022 | 1.06 | 1.27 | 0.926 |
| 09.07.2022 | 1.4 | 1.97 | 1.03 |
| 08.07.2022 | 3.47 | 8.07 | 1.15 |
| 07.07.2022 | 0.68 | 1.03 | 0.65 |
© Bayerisches Landesamt für Umwelt 2024