

Chart of year Bad Trißl / Auerbach
Discharge from 14.07.2020 to 13.07.2021
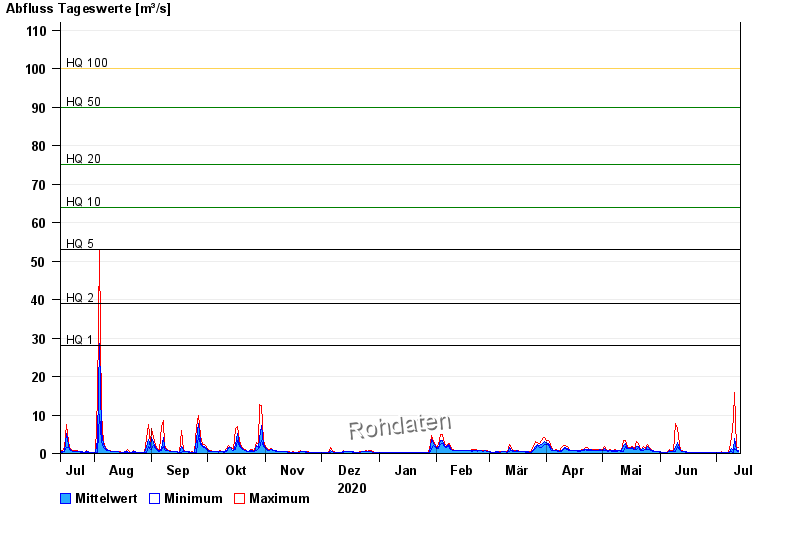
- HQ1 28 m³/s
- HQ2 39 m³/s
- HQ5 53 m³/s
- HQ10 64 m³/s
- HQ20 75 m³/s
- HQ50 90 m³/s
- HQ100 100 m³/s
| Date | Mean value [m³/s] | Maximum [m³/s] | Minimum [m³/s] |
|---|---|---|---|
| 13.07.2021 | 0.803 | 1.51 | 0.602 |
| 12.07.2021 | 0.933 | 1.3 | 0.671 |
| 11.07.2021 | 3.99 | 15.8 | 1.3 |
| 10.07.2021 | 0.655 | 9.1 | 0.298 |
| 09.07.2021 | 1.31 | 4.1 | 0.487 |
| 08.07.2021 | 0.255 | 1.01 | 0.198 |
| 07.07.2021 | 0.208 | 0.229 | 0.198 |
© Bayerisches Landesamt für Umwelt 2024