

Chart of year Bad Trißl / Auerbach
Discharge from 14.07.2019 to 13.07.2020
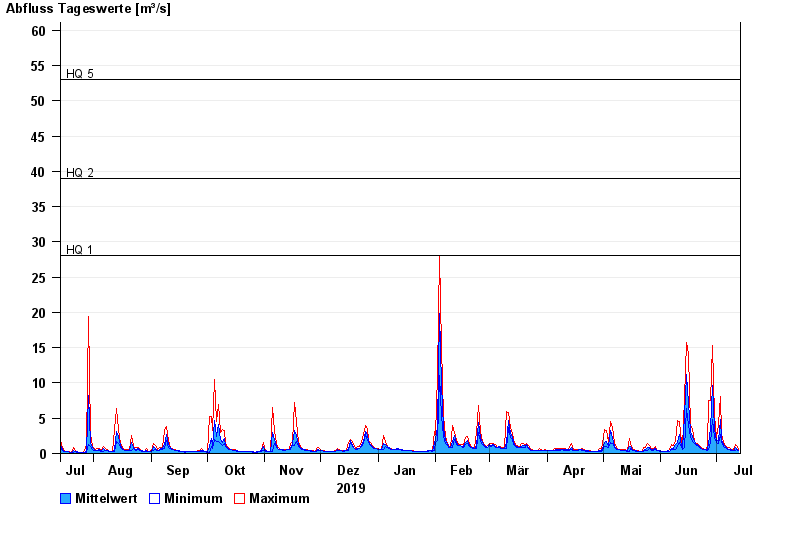
- HQ1 28 m³/s
- HQ2 39 m³/s
- HQ5 53 m³/s
- HQ10 64 m³/s
- HQ20 75 m³/s
- HQ50 90 m³/s
- HQ100 100 m³/s
| Date | Mean value [m³/s] | Maximum [m³/s] | Minimum [m³/s] |
|---|---|---|---|
| 13.07.2020 | 0.463 | 0.542 | 0.411 |
| 12.07.2020 | 0.696 | 1.1 | 0.542 |
| 11.07.2020 | 0.814 | 1.22 | 0.479 |
| 10.07.2020 | 0.479 | 0.547 | 0.417 |
| 09.07.2020 | 0.522 | 0.552 | 0.481 |
| 08.07.2020 | 0.614 | 0.799 | 0.552 |
| 07.07.2020 | 0.739 | 0.804 | 0.63 |
© Bayerisches Landesamt für Umwelt 2024