

Chart of year Bad Trißl / Auerbach
Discharge from 19.10.2022 to 18.10.2023
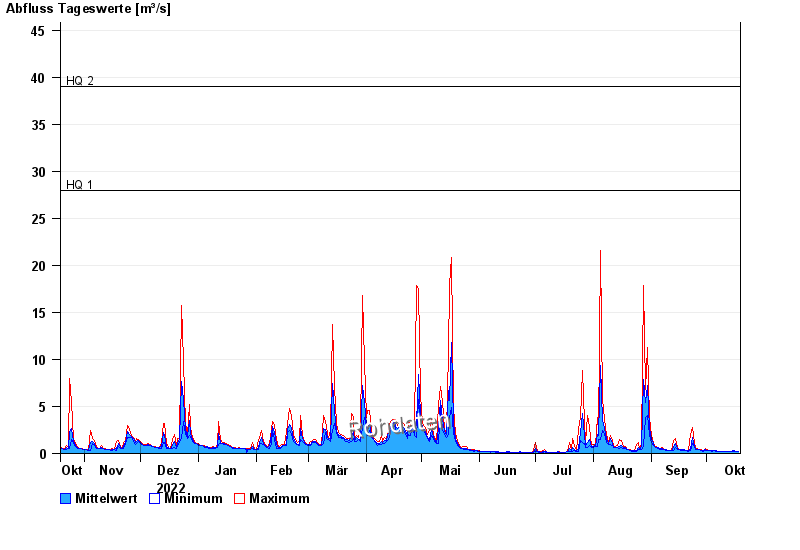
- HQ1 28 m³/s
- HQ2 39 m³/s
- HQ5 53 m³/s
- HQ10 64 m³/s
- HQ20 75 m³/s
- HQ50 90 m³/s
- HQ100 100 m³/s
| Date | Mean value [m³/s] | Maximum [m³/s] | Minimum [m³/s] |
|---|---|---|---|
| 18.10.2023 | 0.223 | 0.223 | 0.223 |
| 17.10.2023 | 0.23 | 0.263 | 0.223 |
| 16.10.2023 | 0.273 | 0.308 | 0.263 |
| 15.10.2023 | 0.273 | 0.308 | 0.263 |
| 14.10.2023 | 0.229 | 0.263 | 0.223 |
| 13.10.2023 | 0.223 | 0.223 | 0.223 |
| 12.10.2023 | 0.257 | 0.263 | 0.223 |
© Bayerisches Landesamt für Umwelt 2024