

Chart of year Bad Trißl / Auerbach
Discharge from 19.10.2021 to 18.10.2022
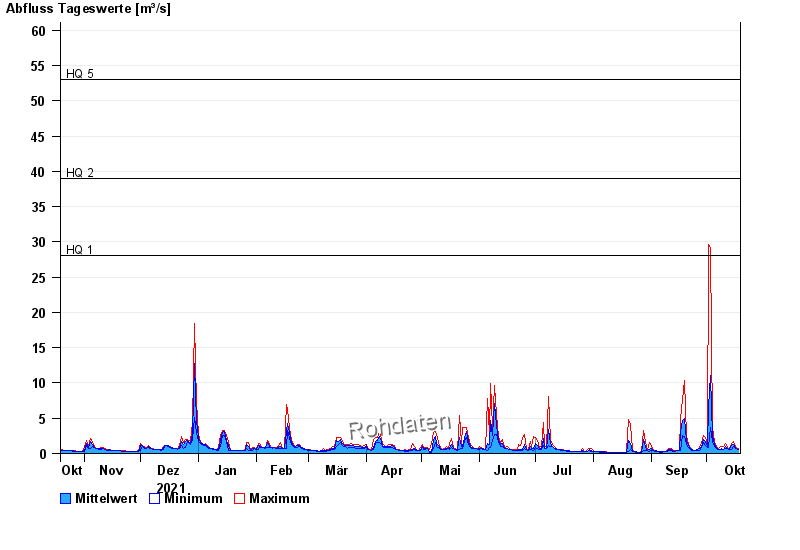
- HQ1 28 m³/s
- HQ2 39 m³/s
- HQ5 53 m³/s
- HQ10 64 m³/s
- HQ20 75 m³/s
- HQ50 90 m³/s
- HQ100 100 m³/s
| Date | Mean value [m³/s] | Maximum [m³/s] | Minimum [m³/s] |
|---|---|---|---|
| 18.10.2022 | 0.593 | 0.724 | 0.567 |
| 17.10.2022 | 0.745 | 0.815 | 0.641 |
| 16.10.2022 | 1.03 | 1.25 | 0.815 |
| 15.10.2022 | 1.33 | 1.64 | 1.02 |
| 14.10.2022 | 1.08 | 1.37 | 0.498 |
| 13.10.2022 | 0.547 | 0.641 | 0.498 |
| 12.10.2022 | 0.734 | 0.913 | 0.641 |
© Bayerisches Landesamt für Umwelt 2024