

Chart of year Bad Trißl / Auerbach
Discharge from 19.10.2020 to 18.10.2021
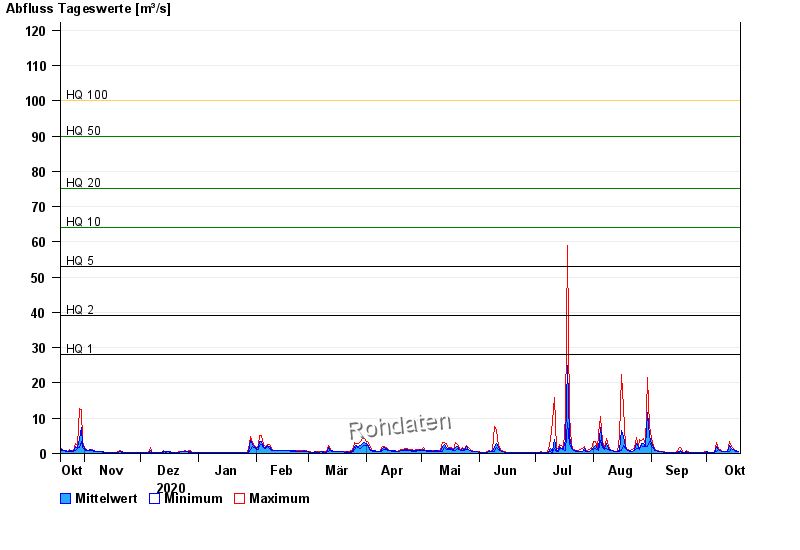
- HQ1 28 m³/s
- HQ2 39 m³/s
- HQ5 53 m³/s
- HQ10 64 m³/s
- HQ20 75 m³/s
- HQ50 90 m³/s
- HQ100 100 m³/s
| Date | Mean value [m³/s] | Maximum [m³/s] | Minimum [m³/s] |
|---|---|---|---|
| 18.10.2021 | 0.6 | 0.664 | 0.531 |
| 17.10.2021 | 0.709 | 0.815 | 0.664 |
| 16.10.2021 | 0.892 | 1.09 | 0.815 |
| 15.10.2021 | 1.18 | 1.39 | 1.09 |
| 14.10.2021 | 1.47 | 1.87 | 1.29 |
| 13.10.2021 | 2.27 | 3.32 | 0.595 |
| 12.10.2021 | 0.486 | 0.595 | 0.472 |
© Bayerisches Landesamt für Umwelt 2024