

Chart of year Bad Trißl / Auerbach
Discharge from 09.08.2021 to 08.08.2022
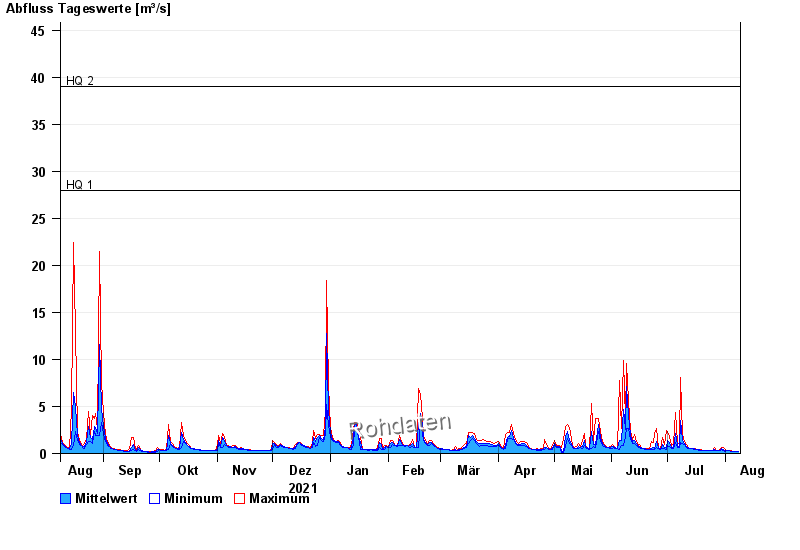
- HQ1 28 m³/s
- HQ2 39 m³/s
- HQ5 53 m³/s
- HQ10 64 m³/s
- HQ20 75 m³/s
- HQ50 90 m³/s
- HQ100 100 m³/s
| Date | Mean value [m³/s] | Maximum [m³/s] | Minimum [m³/s] |
|---|---|---|---|
| 08.08.2022 | 0.199 | 0.235 | 0.198 |
| 07.08.2022 | 0.231 | 0.235 | 0.198 |
| 06.08.2022 | 0.234 | 0.235 | 0.198 |
| 05.08.2022 | 0.227 | 0.235 | 0.198 |
| 04.08.2022 | 0.257 | 0.277 | 0.235 |
| 03.08.2022 | 0.277 | 0.277 | 0.277 |
| 02.08.2022 | 0.289 | 0.325 | 0.277 |
© Bayerisches Landesamt für Umwelt 2024