

Chart of year Bad Trißl / Auerbach
Discharge from 09.08.2020 to 08.08.2021
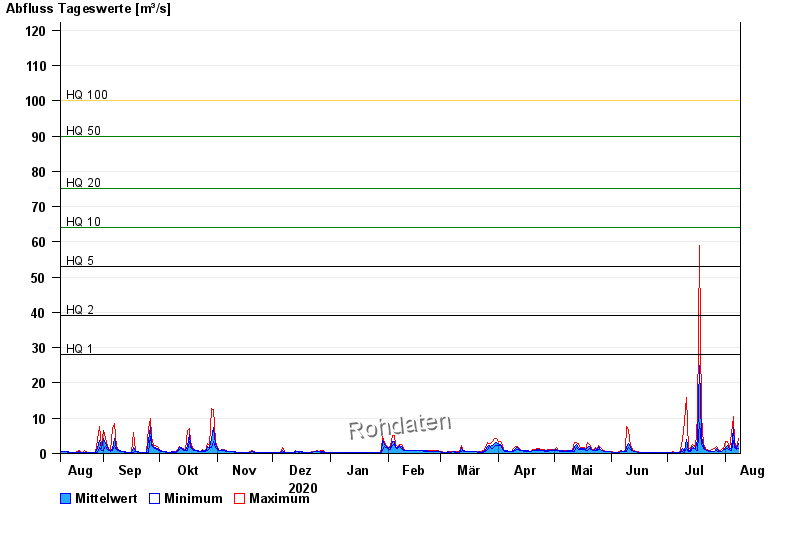
- HQ1 28 m³/s
- HQ2 39 m³/s
- HQ5 53 m³/s
- HQ10 64 m³/s
- HQ20 75 m³/s
- HQ50 90 m³/s
- HQ100 100 m³/s
| Date | Mean value [m³/s] | Maximum [m³/s] | Minimum [m³/s] |
|---|---|---|---|
| 08.08.2021 | 2.71 | 4.22 | 1.3 |
| 07.08.2021 | 1.37 | 1.63 | 1.2 |
| 06.08.2021 | 2.37 | 3.54 | 1.63 |
| 05.08.2021 | 7.23 | 10.4 | 3.77 |
| 04.08.2021 | 1.43 | 5.75 | 0.906 |
| 03.08.2021 | 1.1 | 1.3 | 0.997 |
| 02.08.2021 | 2.17 | 3.33 | 1.3 |
© Bayerisches Landesamt für Umwelt 2024