

Chart of total period Bad Trißl / Auerbach
Discharge from 01.11.1948 to 26.04.2024
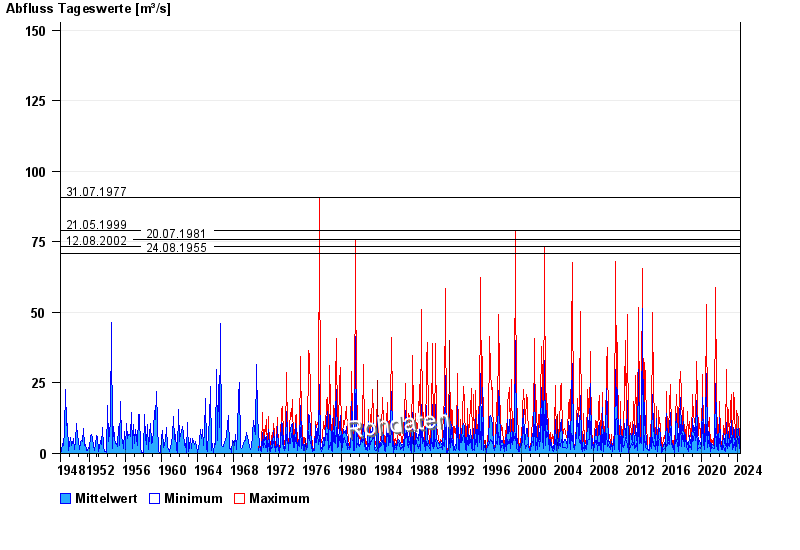
- 31.07.1977 Abfluss: 90,6 m³/s
- 21.05.1999 Abfluss: 79 m³/s
- 20.07.1981 Abfluss: 75,8 m³/s
- 12.08.2002 Abfluss: 73,3 m³/s
- 24.08.1955 Abfluss: 70,9 m³/s
| Date | Mean value [m³/s] | Maximum [m³/s] | Minimum [m³/s] |
|---|---|---|---|
| 26.04.2024 | 1.59 | 3.42 | 1.25 |
| 25.04.2024 | 1.23 | 1.64 | 1.02 |
| 24.04.2024 | 1.07 | 1.25 | 1.02 |
| 23.04.2024 | 1.2 | 1.37 | 1.13 |
| 22.04.2024 | 1.46 | 1.78 | 1.37 |
| 21.04.2024 | 1.41 | 1.78 | 1.13 |
| 20.04.2024 | 1.1 | 1.5 | 0.724 |
© Bayerisches Landesamt für Umwelt 2024