

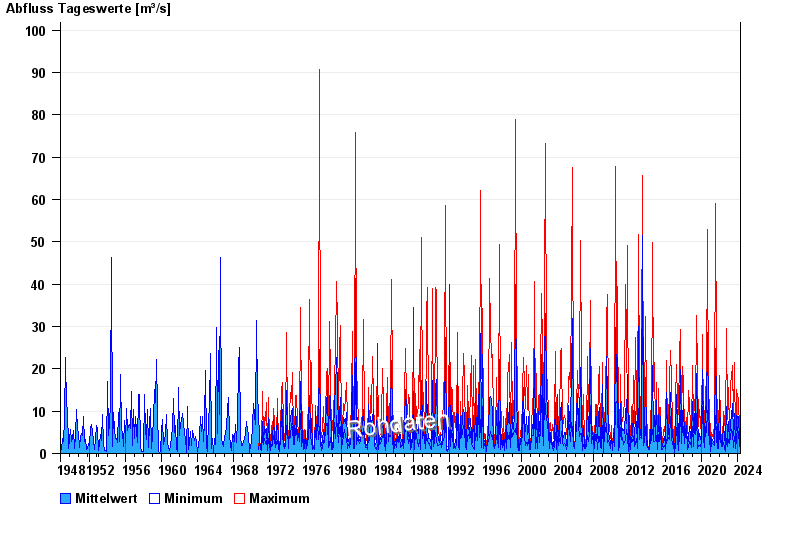
Chart of total period Bad Trißl / Auerbach
Discharge from 01.11.1948 to 19.04.2024
| Date | Mean value [m³/s] | Maximum [m³/s] | Minimum [m³/s] |
|---|---|---|---|
| 19.04.2024 | 0.504 | 0.567 | 0.435 |
| 18.04.2024 | 0.497 | 0.724 | 0.379 |
| 17.04.2024 | 0.385 | 0.498 | 0.326 |
| 16.04.2024 | 0.352 | 0.379 | 0.326 |
| 15.04.2024 | 0.356 | 0.435 | 0.326 |
| 14.04.2024 | 0.354 | 0.379 | 0.326 |
| 13.04.2024 | 0.376 | 0.379 | 0.326 |
© Bayerisches Landesamt für Umwelt 2024