

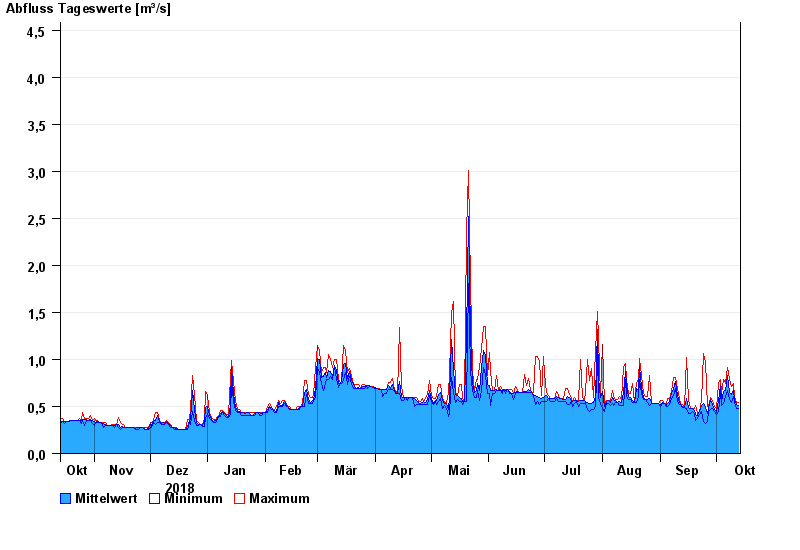
Chart of year Bad Tölz / Ellbach
Discharge from 14.10.2018 to 13.10.2019
- 30.05.1940 Abfluss: 19,8 m³/s
- 23.07.1966 Abfluss: 11,8 m³/s
- 09.07.1954 Abfluss: 11,6 m³/s
- 07.07.1946 Abfluss: 9,23 m³/s
- 21.05.1999 Abfluss: 9,1 m³/s
| Date | Mean value [m³/s] | Maximum [m³/s] | Minimum [m³/s] |
|---|---|---|---|
| 13.10.2019 | 0.507 | 0.538 | 0.477 |
| 12.10.2019 | 0.517 | 0.537 | 0.477 |
| 11.10.2019 | 0.562 | 0.602 | 0.537 |
| 10.10.2019 | 0.673 | 0.749 | 0.602 |
| 09.10.2019 | 0.631 | 0.71 | 0.537 |
| 08.10.2019 | 0.651 | 0.788 | 0.569 |
| 07.10.2019 | 0.831 | 0.919 | 0.672 |
© Bayerisches Landesamt für Umwelt 2024