

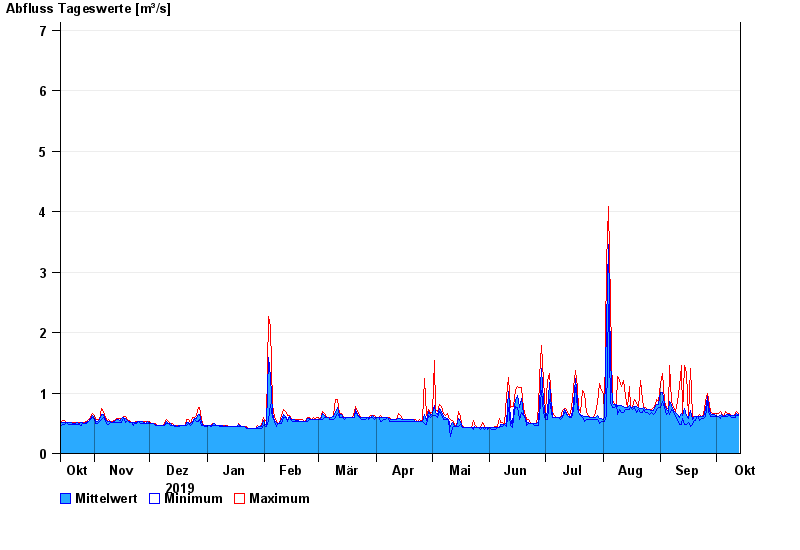
Chart of year Bad Tölz / Ellbach
Discharge from 14.10.2019 to 13.10.2020
- 30.05.1940 Abfluss: 19,8 m³/s
- 23.07.1966 Abfluss: 11,8 m³/s
- 09.07.1954 Abfluss: 11,6 m³/s
- 07.07.1946 Abfluss: 9,23 m³/s
- 21.05.1999 Abfluss: 9,1 m³/s
| Date | Mean value [m³/s] | Maximum [m³/s] | Minimum [m³/s] |
|---|---|---|---|
| 13.10.2020 | 0.642 | 0.665 | 0.628 |
| 12.10.2020 | 0.661 | 0.701 | 0.626 |
| 11.10.2020 | 0.625 | 0.663 | 0.59 |
| 10.10.2020 | 0.622 | 0.625 | 0.589 |
| 09.10.2020 | 0.622 | 0.624 | 0.588 |
| 08.10.2020 | 0.641 | 0.658 | 0.621 |
| 07.10.2020 | 0.652 | 0.657 | 0.62 |
© Bayerisches Landesamt für Umwelt 2024