

Chart of year Bad Tölz / Ellbach
Discharge from 19.11.2018 to 18.11.2019
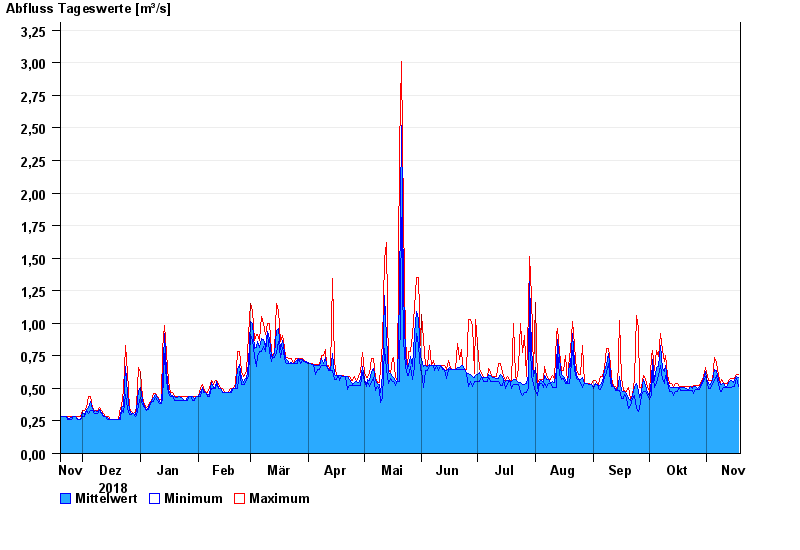
| Date | Mean value [m³/s] | Maximum [m³/s] | Minimum [m³/s] |
|---|---|---|---|
| 18.11.2019 | 0.581 | 0.609 | 0.514 |
| 17.11.2019 | 0.593 | 0.608 | 0.574 |
| 16.11.2019 | 0.571 | 0.574 | 0.512 |
| 15.11.2019 | 0.544 | 0.573 | 0.511 |
| 14.11.2019 | 0.561 | 0.572 | 0.509 |
| 13.11.2019 | 0.556 | 0.571 | 0.508 |
| 12.11.2019 | 0.525 | 0.538 | 0.507 |
© Bayerisches Landesamt für Umwelt 2024