

Chart of year Bad Tölz / Ellbach
Discharge from 19.11.2019 to 18.11.2020
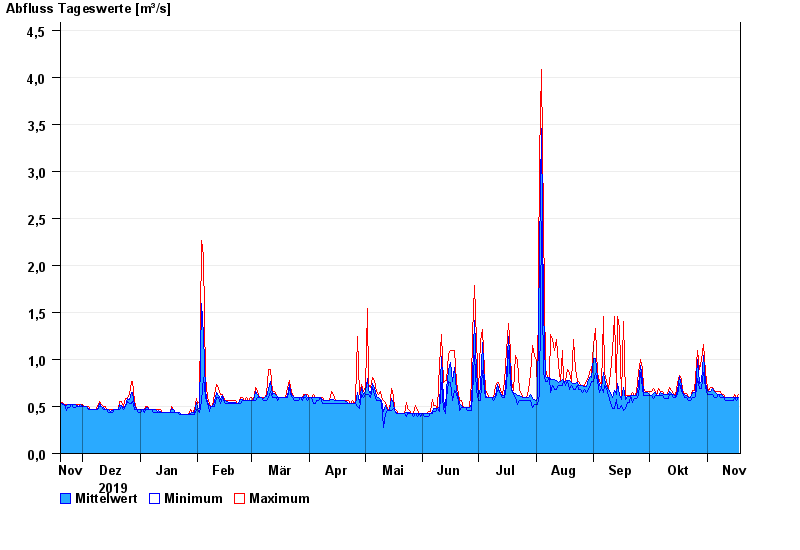
| Date | Mean value [m³/s] | Maximum [m³/s] | Minimum [m³/s] |
|---|---|---|---|
| 18.11.2020 | 0.598 | 0.631 | 0.596 |
| 17.11.2020 | 0.595 | 0.596 | 0.563 |
| 16.11.2020 | 0.598 | 0.63 | 0.596 |
| 15.11.2020 | 0.594 | 0.596 | 0.562 |
| 14.11.2020 | 0.594 | 0.595 | 0.562 |
| 13.11.2020 | 0.593 | 0.595 | 0.562 |
| 12.11.2020 | 0.593 | 0.595 | 0.561 |
© Bayerisches Landesamt für Umwelt 2024