

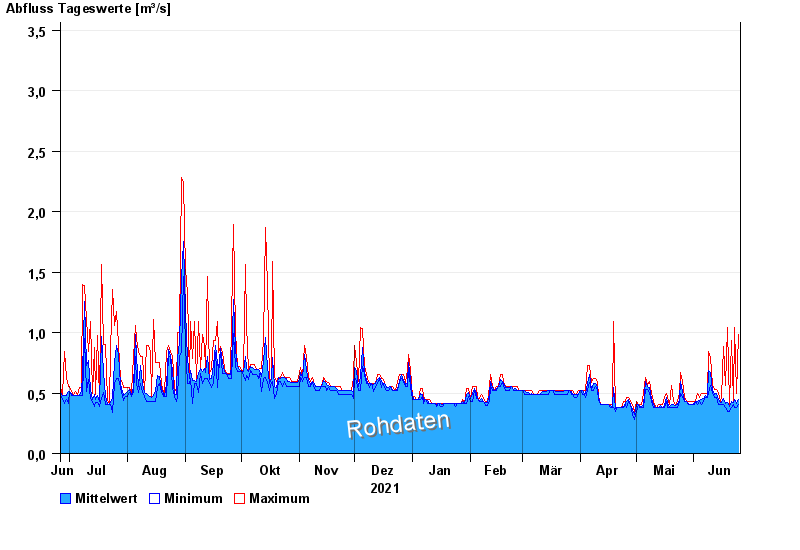
Chart of year Bad Tölz / Ellbach
Discharge from 26.06.2021 to 25.06.2022
- 30.05.1940 Abfluss: 19,8 m³/s
- 23.07.1966 Abfluss: 11,8 m³/s
- 09.07.1954 Abfluss: 11,6 m³/s
- 07.07.1946 Abfluss: 9,23 m³/s
- 21.05.1999 Abfluss: 9,1 m³/s
| Date | Mean value [m³/s] | Maximum [m³/s] | Minimum [m³/s] |
|---|---|---|---|
| 25.06.2022 | 0.449 | 0.987 | 0.404 |
| 24.06.2022 | 0.414 | 0.494 | 0.377 |
| 23.06.2022 | 0.447 | 1.04 | 0.377 |
| 22.06.2022 | 0.424 | 0.432 | 0.404 |
| 21.06.2022 | 0.433 | 0.935 | 0.377 |
| 20.06.2022 | 0.392 | 0.404 | 0.35 |
| 19.06.2022 | 0.424 | 1.04 | 0.35 |
© Bayerisches Landesamt für Umwelt 2024