

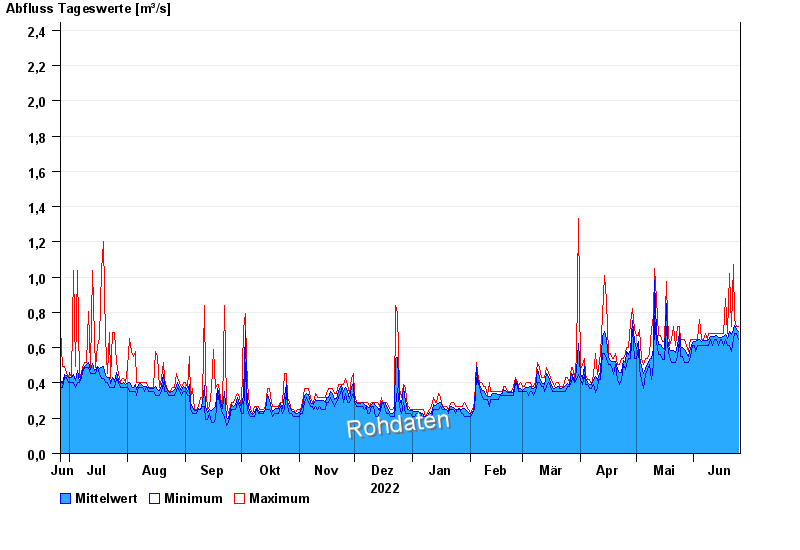
Chart of year Bad Tölz / Ellbach
Discharge from 26.06.2022 to 25.06.2023
- 30.05.1940 Abfluss: 19,8 m³/s
- 23.07.1966 Abfluss: 11,8 m³/s
- 09.07.1954 Abfluss: 11,6 m³/s
- 07.07.1946 Abfluss: 9,23 m³/s
- 21.05.1999 Abfluss: 9,1 m³/s
| Date | Mean value [m³/s] | Maximum [m³/s] | Minimum [m³/s] |
|---|---|---|---|
| 25.06.2023 | 0.689 | 0.719 | 0.647 |
| 24.06.2023 | 0.701 | 0.719 | 0.683 |
| 23.06.2023 | 0.723 | 0.757 | 0.683 |
| 22.06.2023 | 0.704 | 1.07 | 0.647 |
| 21.06.2023 | 0.672 | 0.719 | 0.58 |
| 20.06.2023 | 0.694 | 1.02 | 0.613 |
| 19.06.2023 | 0.652 | 0.683 | 0.613 |
© Bayerisches Landesamt für Umwelt 2024