
- Start >
- Rivers >
- Discharge >
- Isar >
- Bad Feilnbach >
- Chart of year

Chart of year Bad Feilnbach / Mühlbach
Discharge from 01.01.2024 to 26.04.2024
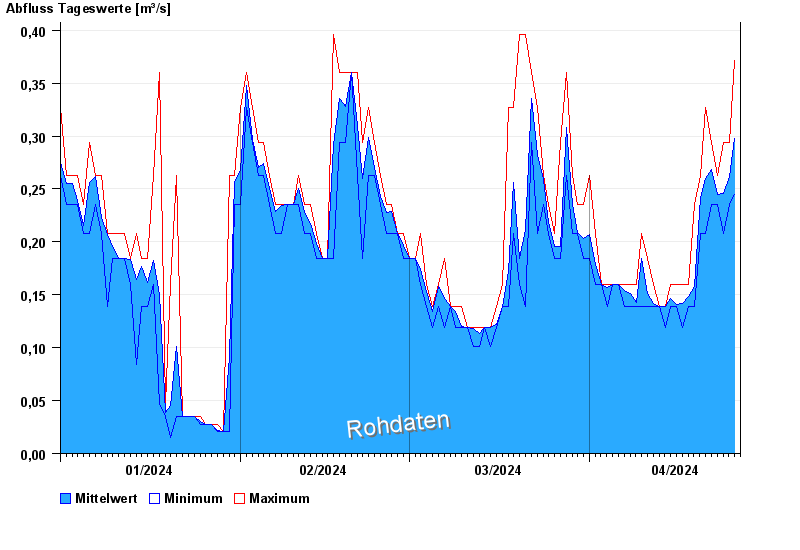
| Date | Mean value [m³/s] | Maximum [m³/s] | Minimum [m³/s] |
|---|---|---|---|
| 26.04.2024 | 0.256 | 0.294 | 0.235 |
| 25.04.2024 | 0.262 | 0.294 | 0.235 |
| 24.04.2024 | 0.246 | 0.294 | 0.208 |
| 23.04.2024 | 0.245 | 0.263 | 0.235 |
| 22.04.2024 | 0.268 | 0.294 | 0.235 |
| 21.04.2024 | 0.26 | 0.327 | 0.208 |
| 20.04.2024 | 0.242 | 0.263 | 0.208 |
© Bayerisches Landesamt für Umwelt 2024